Climate Risk Analytics

Know the financial cost of climate risk at every site

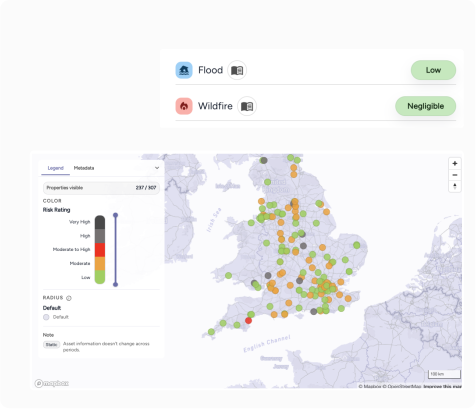
SmartResilience maps every asset against seven physical hazards and calculates annualised financial loss at site level, so your finance team has numbers to act on and your disclosures have the evidence to hold up to external review.

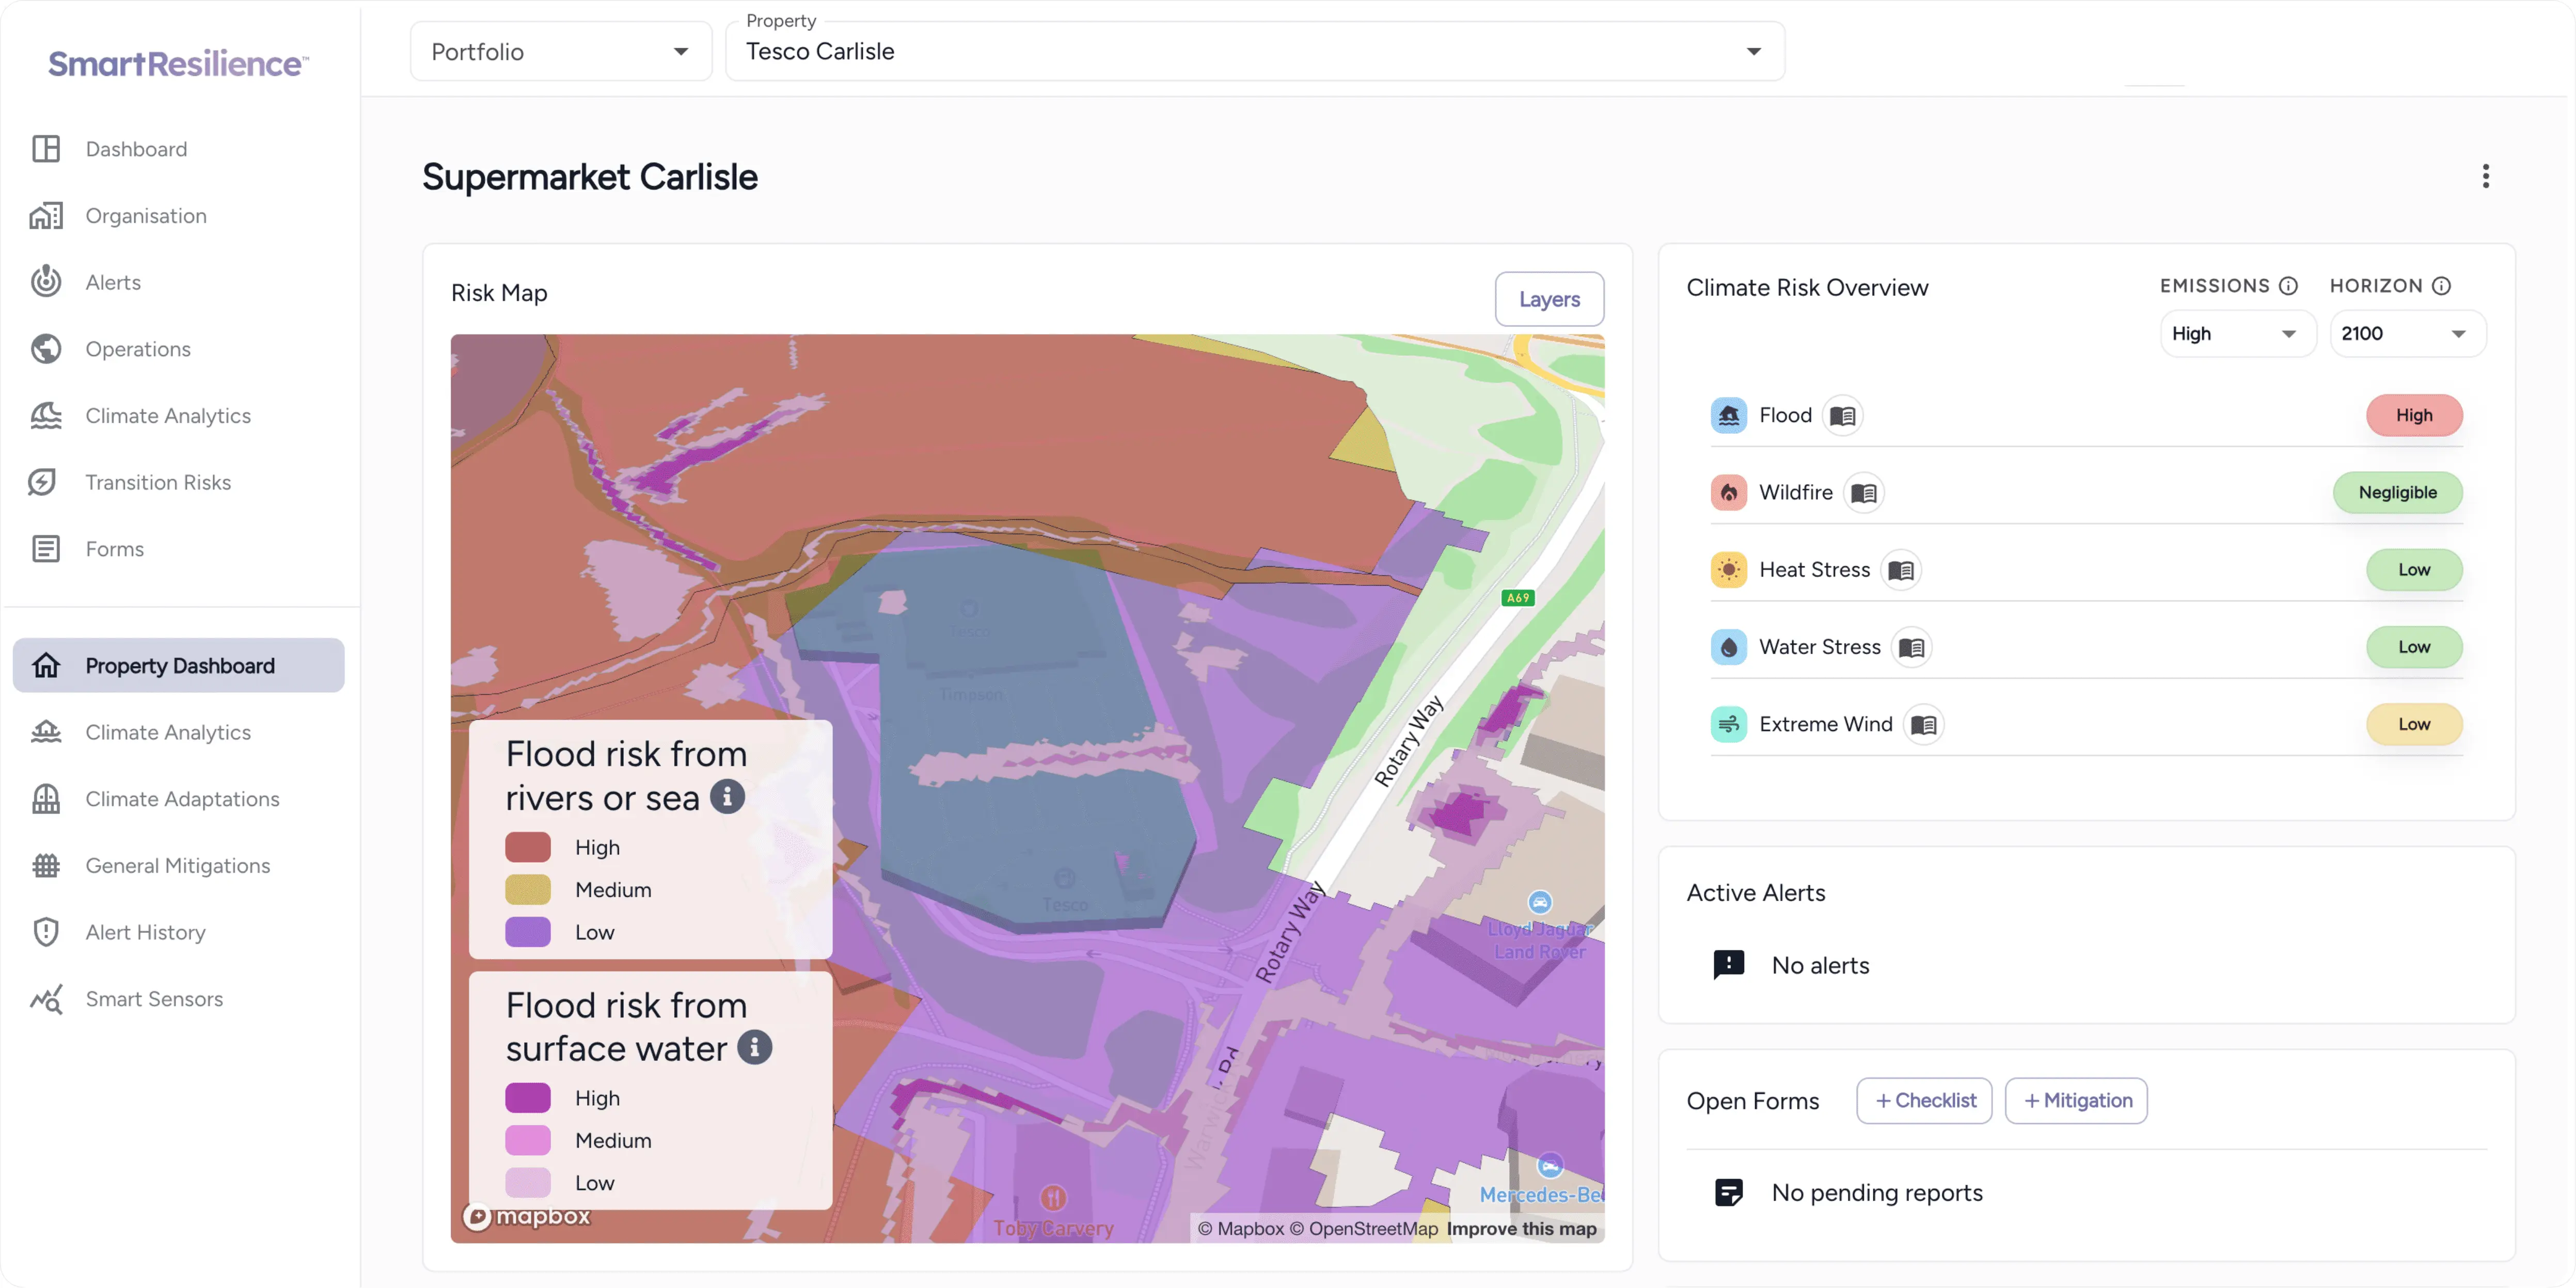
SmartResilience platform showing property risk map and climate risk overview by hazard
Group 1
Sainsbury's
Bupa
The Crown Estate
Meadow Foods

WHAT YOU CAN DO

From risk rating to financial decision

Turn your static reports into auditable financial figures.

Quantify financial exposure

Map every asset across seven physical hazards and calculate annualised financial loss at site level

You provide your site list, we run the analysis across seven physical hazards. Financial loss is calculated at site level across three emissions scenarios and three time horizons, and updated continuously as your portfolio changes.

  • Seven hazards covered: flood, heat stress, drought, wildfire, hail, extreme wind and water stress — assessed for every site in one platform.
  • Financial figures, not risk ratings: exposure is calculated individually for each hazard at each asset, alongside return period analysis from 1-in-20 to 1-in-1000 year events.
  • Live data, not a one-off report: your analysis updates automatically as your portfolio changes and as climate data evolves. No annual re-engagement, no outputs that are out of date the moment they land.

[Image placeholder]

Platform capabilities

Site-level financial quantification

Annualised loss figures per site per hazard. The number her CFO engages with.

Adaptation ROI modelling

Every measure ranked by cost and financial loss prevented. The business case her finance team needs to approve budget.

Multi-framework regulatory output

IFRS S2, TCFD, CSRD, ASRS and UK SRS from one live dataset. No reformatting, no re-engagement.

Full data lineage

Every figure traceable to its source. The thing that makes her disclosures defensible when an auditor challenges them.

Live data, continuous updates

Analysis updates automatically as her portfolio and regulations change. Replaces the annual consultancy cycle entirely.

Portfolio-scale coverage

Every site, every hazard, one platform. No stitching together outputs from multiple providers across geographies.

THE PROCESS

Operational resilience, tailored to your business

Provide your location data and we handle everything else, from geocoding and risk analysis to configuration, training and handover.

01

See it on your portfolio

Book a session with our team and we will show you the platform running on assets like yours.

02

Share your site list

Addresses, coordinates and property usage type for your full estate. Any format, any scale.

03

We run the analysis

Every site geocoded, verified against satellite imagery and assessed across all seven physical hazards under three emissions scenarios and three time horizons.

04

We validate the outputs with your team

Before anything goes live, we run a data validation session to confirm accuracy and address any anomalies specific to your portfolio.

05

Your platform goes live

Every site has a financial exposure figure. Your full estate is sortable by financial risk. Regulatory outputs are ready. The analysis updates automatically from here.

Customer Story

Sainsbury's

A site-specific alert came 12 hours before the flood hit, preventing £3 million in business losses.

[Name]

[Job title, Sainsbury's]

Read the full case study →
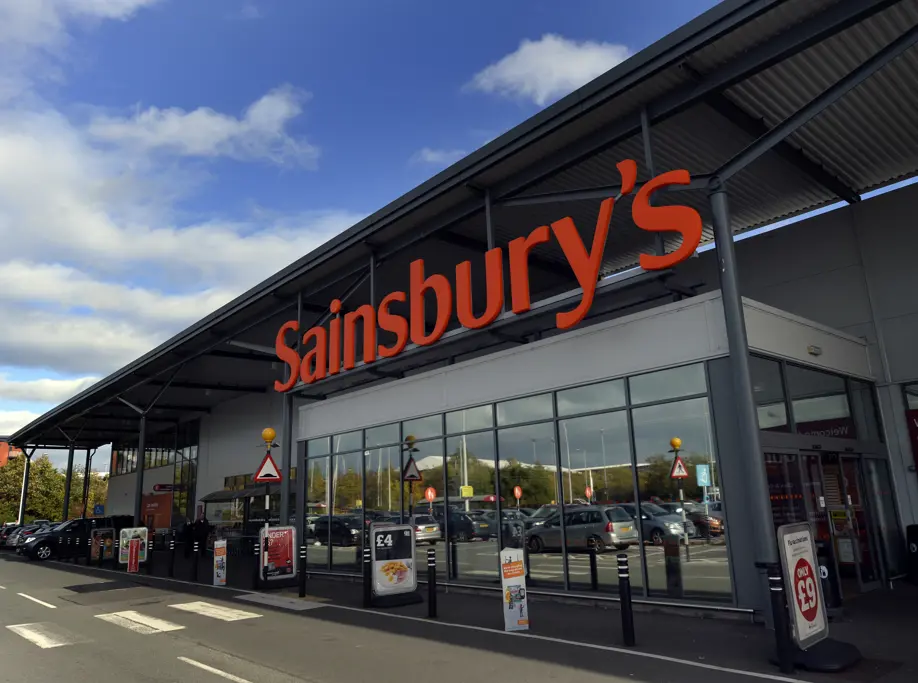
Sainsbury's supermarket in sunset

Try SmartResilience for free today

See our SmartResilience platform in action and gain a greater understanding of its functionality with a free demo. Book your session here.

This site is protected by reCAPTCHA and the Google Privacy Policy and Terms of Service apply.
smartresilience app on a computer screen
Copyright© 2026 SmartResilience Ltd