What climate risks matter most for retailers and grocers?
+
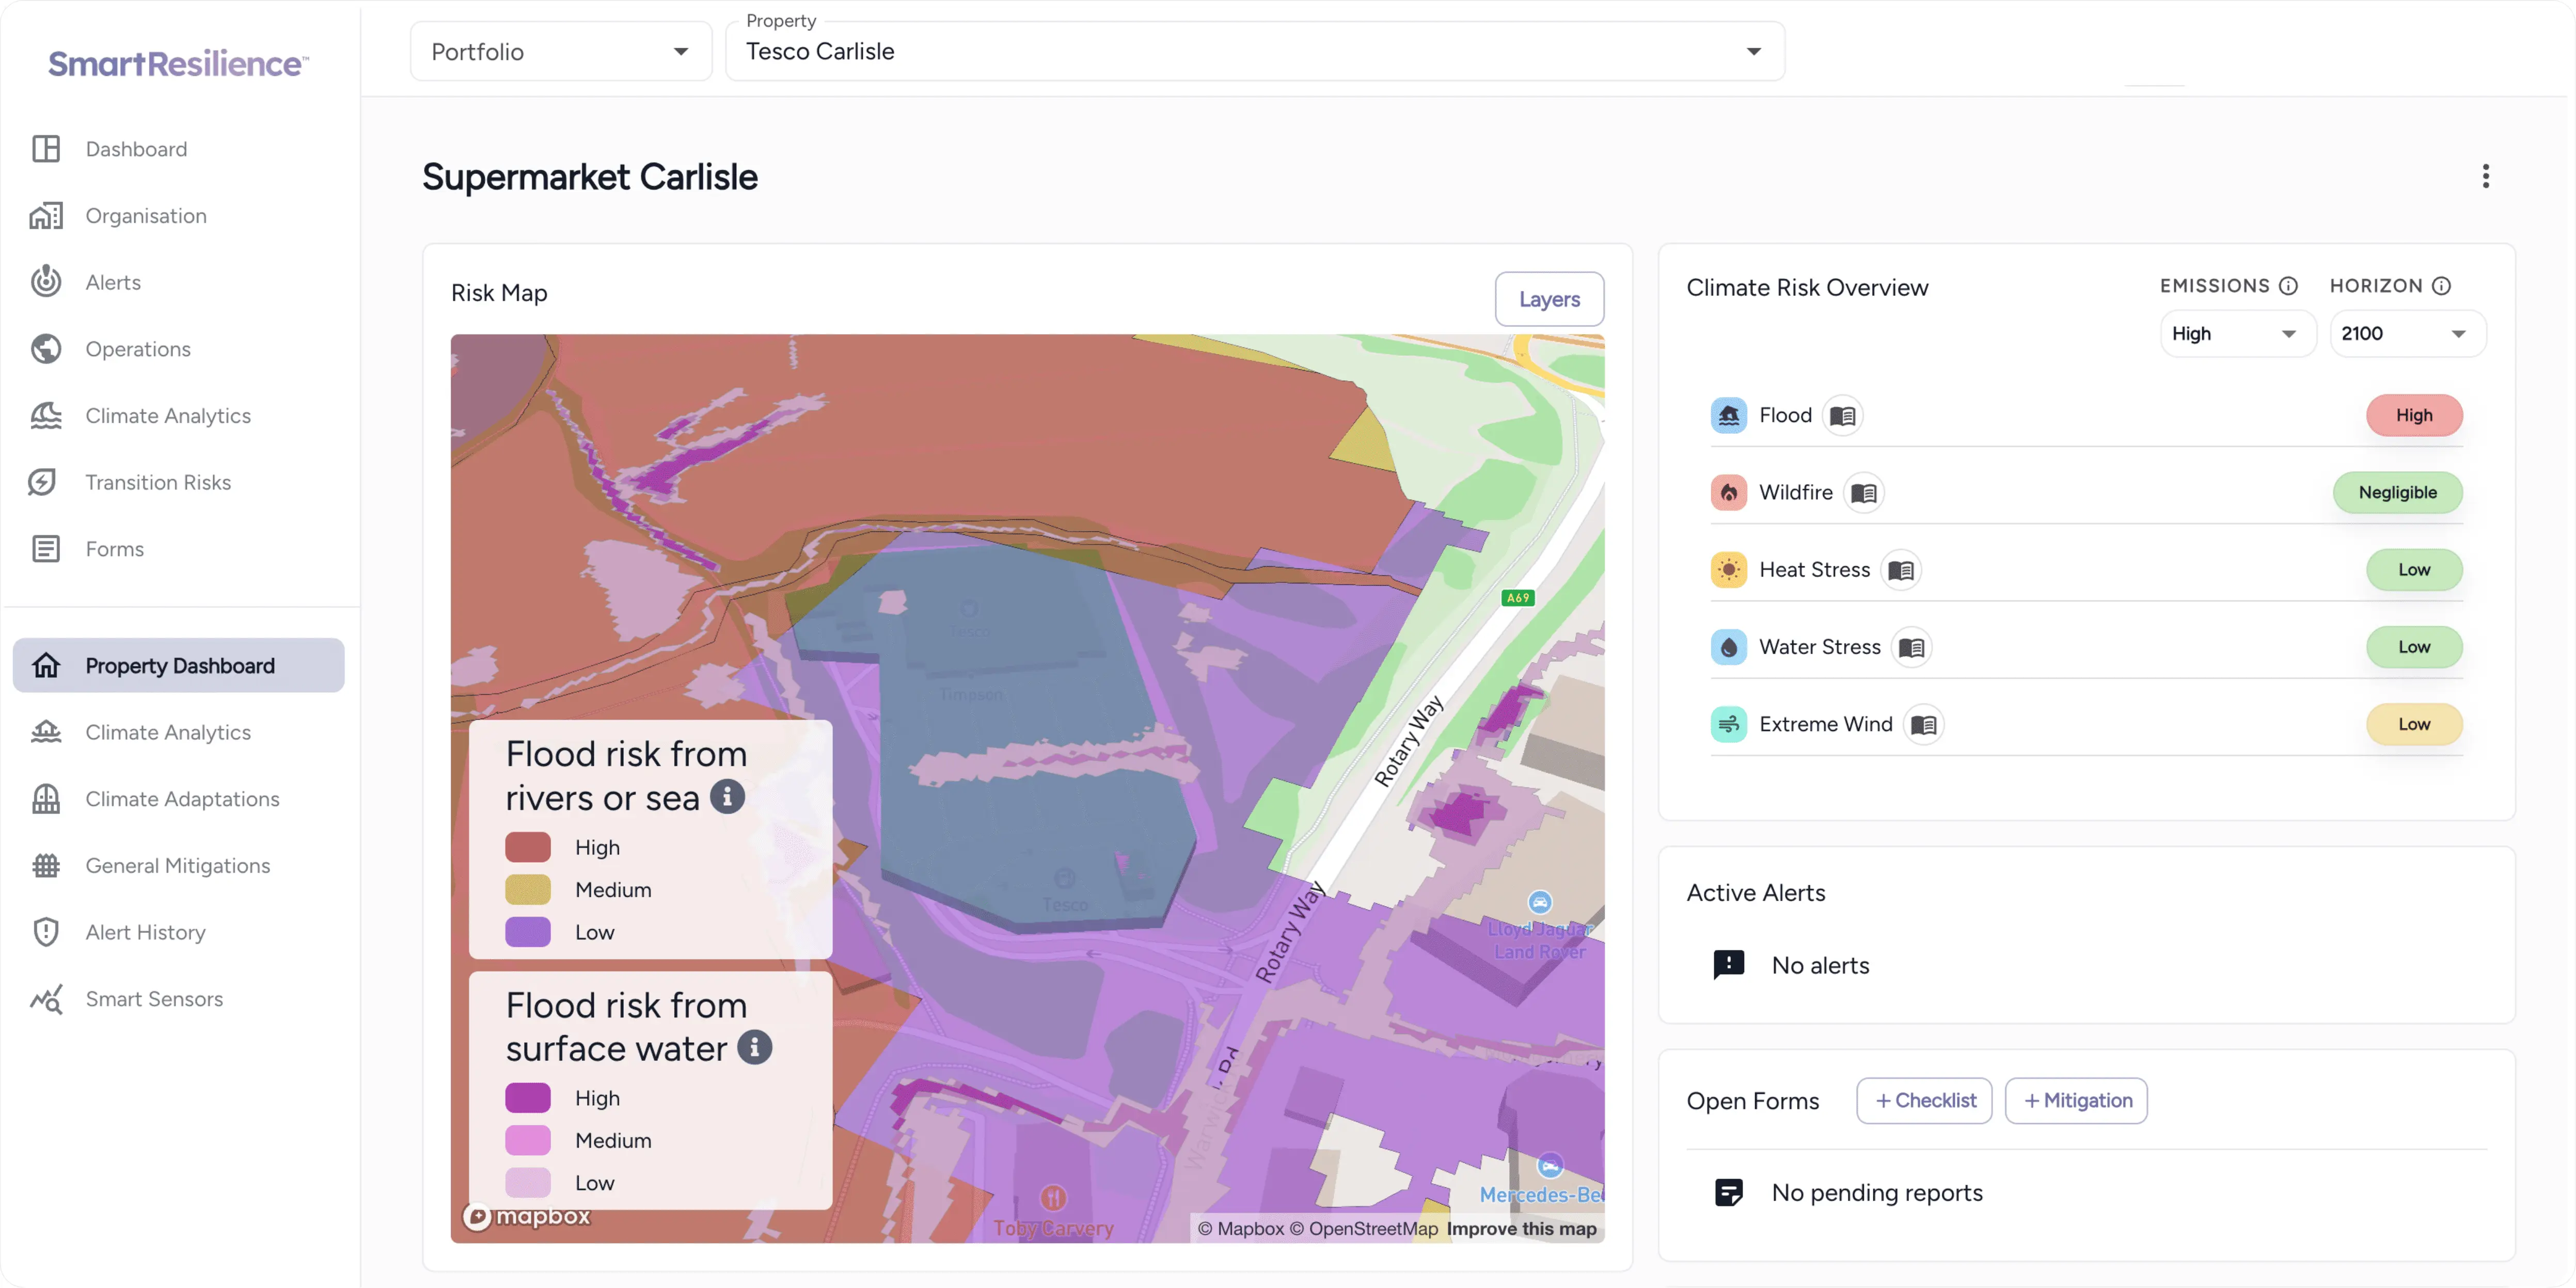
For many retail estates, flooding from rivers and surface water tends to cause the largest losses, with storm damage and heat also significant. Food retailers carry extra exposure through perishable stock and refrigeration, and through suppliers in regions affected by drought and heat. The balance differs by estate, which is why a site-by-site assessment comes first.
How do retailers measure the financial cost of climate risk?
+
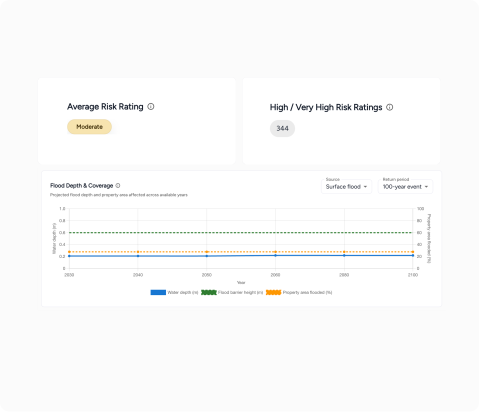
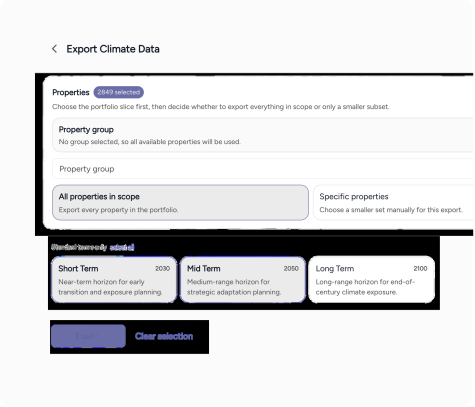
A common measure is annual average loss: the damage and disruption a site can expect in an average year, expressed as a financial figure. The cost of a 1-in-200 year event shows the loss in a severe year. SmartResilience calculates both for flood, wind and wildfire at every store and depot, under three emissions scenarios and time horizons up to 2090. Heat figures are coming soon.
Where do the loss figures come from?
+
For each site, the platform estimates hazard levels at different return periods, such as flood depth in a 1-in-100 year event. A damage curve for that building type turns each level into the share of asset value lost, and averaging gives the annual average loss. The data comes from recognised sources, including CMIP6 climate projections, JBA flood maps, ERA5 wind data and WRI Aqueduct, and you can trace every figure back to its source.
How is this different from a consultancy climate risk report?
+
A consultancy report gives a snapshot that firms typically refresh every one to two years. SmartResilience keeps the assessment live: you add or remove stores at any time, the figures update, and the same data drives site-specific warnings and the adaptation ranking. Your teams act on it between reporting cycles as well as at year end.
How is site-specific early warning different from Environment Agency flood alerts?
+
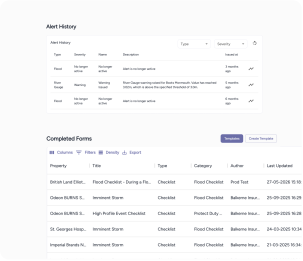
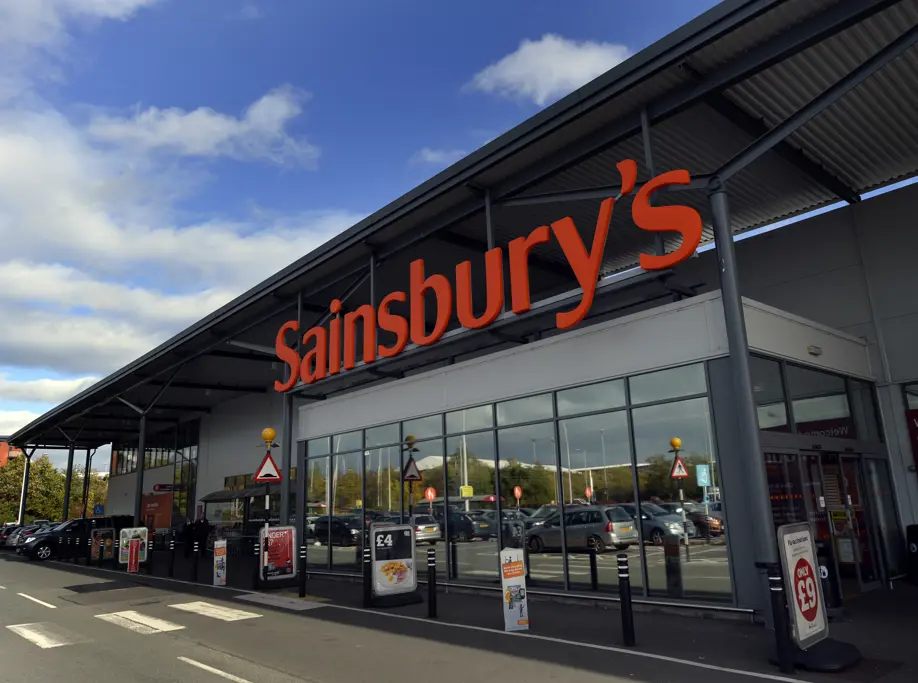
Environment Agency alerts cover areas, apply the same message to every property in them and usually arrive 12 to 24 hours ahead. Site-specific warnings compare forecasts and river gauge readings with each site's own thresholds, giving up to 48 hours of notice, so a store team receives an alert when its own site is at risk, with a pre-configured response that says what to do. At Sainsbury's, the store team received 12 hours of warning before a flood.
How many alerts will our stores receive?
+
A typical site receives 2 to 3 Orange or Red alerts a year. Only those notify your team, while Yellow conditions go into a daily summary. Thresholds start from the river gauge and weather data for each site, and your team can adjust them at any time.
Can we protect leased stores where we cannot change the building?
+
Yes. Many effective measures need no structural work, such as temporary flood barriers, moving stock to height and pre-agreed closure plans. The adaptation ranking shows which temporary and permanent measures make sense at each site, so you can raise the permanent ones with your landlord when they pay back.
Can climate risk data help with insurance renewals?
+
Yes. Insurers increasingly ask for evidence of active risk management. The platform logs every alert, every action and every outcome, and produces mitigation evidence packs your broker can share with insurers at renewal.
Does SmartResilience help with IFRS S2 and UK SRS reporting for retailers?
+
Yes. The platform produces IFRS S2 aligned physical risk disclosures and supports UK SRS S2, CSRD and ASRS, using the same site data that drives the warnings, so you report one set of figures to your auditor, board and investors. It also models transition risk, such as carbon price, energy price and supplier risk, using your Scope 1 and 2 emissions; emissions accounting itself sits with other providers. Organisations should take independent legal and accounting advice on their specific reporting obligations.
Can we assess climate risk in our food supply chain?
+
Existing clients can add a supply chain service that maps suppliers against climate hazards using supplier location, product type and spend. Your sourcing and procurement teams can use it themselves after set-up.
What data do we need to provide?
+
A site list with addresses is enough to start. Asset values and revenue per site let the platform calculate financial loss more precisely. You upload the list and the platform calculates the figures.
How long does it take to get our estate live?
+
Most clients are onboarded within one to two weeks, starting with their highest-risk sites and adding more over time.
Can we screen new stores before we sign a lease or buy a site?
+
Yes. Your property team can check a location's exposure and expected annual loss before committing, so climate risk becomes part of site selection.
Does it work for non-food retailers?
+
Yes. Multi-site retailers with stores, warehouses and distribution centres face similar flood, storm and heat exposure, whatever they sell.