Which climate risks matter most for manufacturers and FMCG companies?
+
For many manufacturers, flooding at plants and warehouses and heat on production lines cause the most direct disruption, with wind damage and water stress also significant. FMCG companies carry extra exposure through farms and suppliers in regions affected by drought and heat. The balance differs by network, which is why a site-by-site assessment comes first.
Which methodology do you use to assess physical climate risk for a global manufacturer?
+
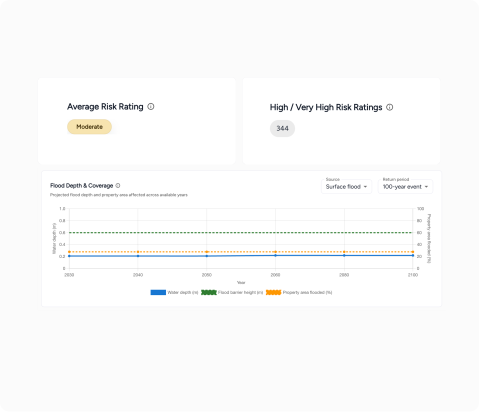
For each site, the platform estimates hazard levels at different return periods, such as flood depth in a 1-in-100 year event. A damage curve for that building type turns each level into the share of asset value lost, and averaging gives the annual average loss. Add revenue and the figure includes business interruption. Flood, wind and wildfire get financial figures today; heat figures are coming soon, and other hazards get risk scores.
How should we prioritise physical climate risk across many locations?
+
Start with the expected financial loss at every site, not a risk rating. Ranking facilities by annual average loss and by the cost of a 1-in-200 year event shows where exposure sits, and comparing the cost of each measure with the loss it avoids shows where spending prevents the most damage. Many clients start with their highest-risk sites and add the rest over time.
How is physical climate risk changing facility and production planning?
+
Manufacturers increasingly use site-level climate data in three decisions: which facilities to protect first, where to locate new plants and warehouses, and how much production to depend on any single site or supplier region. Screening a location before you commit, and modelling measures such as flood barriers or cooling at existing sites, brings climate risk into the same planning cycle as capacity and capital spend.
Can we use one method across all our divisions and countries?
+
Yes. Every site in every country is assessed with the same method and data, so results add up at group level for disclosure and capital planning. A FTSE 100 manufacturer rolled out across 53 countries in six weeks.
How good is the data for sites outside Europe?
+
Flood maps run at 30m resolution worldwide and 5m in the UK, and wind, wildfire, heat and water stress use global datasets such as ERA5, CMIP6 and WRI Aqueduct. Official agency warnings come in from 195 countries.
Can you assess physical climate risk across a global supply chain?
+
Yes, for existing clients. Supply chain risk is an add-on service that maps your suppliers against climate hazards, using supplier location, product type and spend. Procurement and category teams can use it themselves after set-up, next to the risk for your own facilities.
Do you tell our engineers what to do?
+
No. You see the hazard, the expected loss and the cost of each measure against the loss it avoids. Your engineers and site teams decide what to fund and when.
Can we use our own building types and damage assumptions?
+
Yes. Your own building types, damage curves and business interruption assumptions are added at set-up, so results reflect how your plants actually operate.
Does it cover heat at our sites?
+
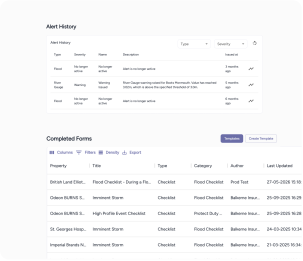
Yes. Every site gets a heat stress score today, with financial figures for heat coming soon. Heat alerts warn site teams before a hot spell, with thresholds set per site.
Do you cover transition risk?
+
Yes. The platform models carbon price, energy price, supplier and competitor risk under Network for Greening the Financial System (NGFS) scenarios, scaled to your sites and regions. This needs your Scope 1 and 2 emissions, and Scope 3 for supplier risk.
Does SmartResilience help with IFRS S2, CSRD and UK SRS reporting?
+
Yes. Outputs are structured for disclosures aligned with IFRS S2, CSRD, ASRS and UK SRS from the same analysis that drives your warnings. Outputs have been reviewed by Big Four auditors as part of client audits. Organisations should take independent legal and accounting advice on their specific reporting obligations.
Which scenarios and time horizons do you use?
+
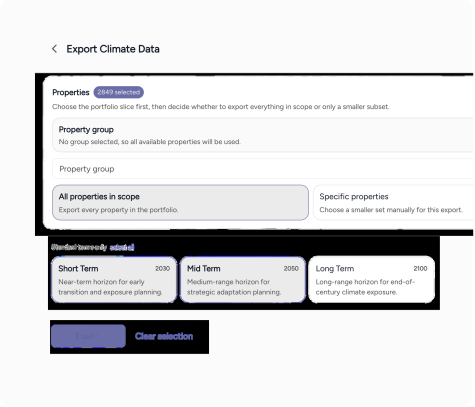
Low, middle and high emissions scenarios (SSP1-2.6, SSP2-4.5 and SSP5-8.5) across 2030, 2050 and 2090. Some horizons can match your own reporting: one global FMCG manufacturer set its short-term horizon to 2029.
How does this compare with a consultancy report?
+
A consultancy report is a snapshot that firms typically refresh every one to two years. SmartResilience keeps the assessment live: you add or remove sites at any time, and the same data drives warnings and the adaptation ranking. One global FMCG manufacturer cut its climate risk analysis costs by more than half against its previous provider.
How long does it take to get started?
+
Most clients are onboarded within one to two weeks, starting with their highest-risk sites. A FTSE 100 manufacturer rolled out across 53 countries in six weeks.