
A business running a physical climate risk assessment can usually list the sites that flooded last year. The same assessment is less likely to name the sites where water stress or coastal erosion has quietly reduced asset value over the past five years, because no single incident ever forced the issue onto anyone's desk. That gap exists because acute and chronic physical risk behave differently, and a hazard register built around only one type tends to miss the other.
What is the difference between acute and chronic physical risk?
Physical risk counts as acute when it traces back to one identifiable event, and chronic when it builds from a slow-moving shift in conditions that resets what counts as normal over time.
Acute risk: an event such as a flood, storm or wildfire, where the damage, the closure and the repair bill all trace back to one date.
Chronic risk: rising sea levels, long-term water stress or gradually increasing average temperatures, where the cost shows up as declining asset value or rising operating expense rather than a dated loss.
Time horizon: acute risk is assessed against near-term event probability, such as the chance of a flood in the next year, while chronic risk is projected across decades to show how conditions such as sea level or average temperature shift by 2050 or 2100.
What are some examples of acute and chronic hazard types?
Acute and chronic hazards each break down into a recognisable set of categories, and the EU Taxonomy, the EU's official classification system for environmentally sustainable economic activity, groups the full set, 28 hazards in total, across four categories: temperature, wind, water and solid mass.
Acute hazards:
Flooding and windstorms: flash flooding happens when rainfall overwhelms drainage faster than it can be absorbed, and windstorms put structural load on a building beyond what its original design assumed; both typically close a site for days, which is why flood is the acute hazard
Wildfire and heatwaves: Wildfire spreads through dry vegetation, carried further by wind-driven embers, and can destroy a structure outright. A heatwave can push cooling systems, refrigeration and worker safety thresholds past their limits, showing up as lost trading hours, spoiled stock or a health and safety incident rather than structural damage.
Hail and other short, sharp events: hailstones can crack roofing materials, glazing and vehicle bodywork within minutes, causing a burst of damage rather than multi-day disruption.
Chronic hazards:
Sea level rise and coastal erosion: sea level rise from thermal expansion and melting ice shifts the baseline tide, while coastal erosion physically removes the land that once buffered a site from the coast, so a location can move into a flood zone without a single new flood event ever occurring.
Rising average and extreme temperature: every additional degree pushes cooling and refrigeration systems to work harder to hold the same internal temperature, raising energy costs and shortening equipment lifespan, and can push a site toward heat-related closures over several summers rather than one.
Water stress and changing precipitation: reduced rainfall and slower groundwater recharge lower the water table over time, and shifting rainfall timing disrupts operations that depend on a predictable water supply, raising input costs without ever appearing on an incident log.
Soil degradation and permafrost thawing: both reduce the ground's load-bearing capacity under a building's foundations over time, raising subsidence risk and, in turn, structural and insurance costs.
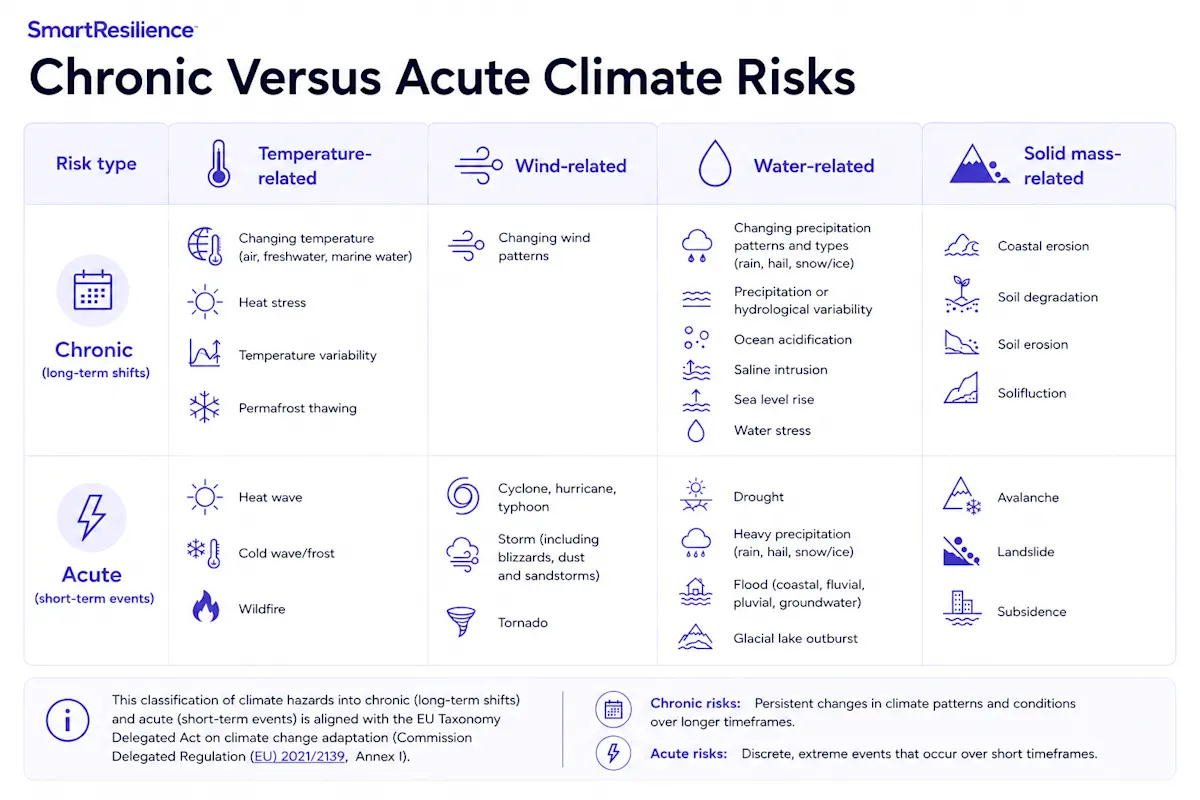
In practice, flood, heat, wind and water stress cover the bulk of real exposure for a UK multi-site estate. The rest of the list exists to catch what a narrower check would miss.
Why is it important to track both acute and chronic physical risk?
Acute risk and chronic risk create financial exposure in different places on a balance sheet, so a hazard register that tracks only one leaves the other building unseen until it becomes far more expensive to address.
That gap in financial exposure surfaces in a few concrete places:
Financial exposure lands differently for each type. Acute risk shows up as a single dated loss, a repair bill, a business interruption claim or a damaged asset, while chronic risk shows up as declining asset value and rising operating costs that never trigger a single incident report.
IFRS S2's physical-risk metric requires a hazard-by-hazard breakdown. IFRS S2 (the International Sustainability Standards Board) climate disclosure standard, asks for figures such as the percentage of insured value sitting in high-risk zones for each hazard, so a register that blends acute and chronic risk into one figure cannot support that disclosure without being rebuilt later.
Insurers price acute and chronic hazards differently. A renewal conversation grounded in hazard-specific evidence for both categories tends to secure better terms than one built on a general risk narrative.
Capital gets misallocated when either type is missing. Ranking sites for adaptation spend using only acute losses can send investment to a site with a dramatic incident history ahead of one where chronic water stress is quietly cutting into asset value every year.
How do acute and chronic hazards compound each other?
Chronic hazards compound acute ones by raising the baseline conditions an acute event has to exceed before it becomes damaging, a mechanism the IPCC's Sixth Assessment Report links to increasing frequency and intensity in several acute hazard types as chronic warming continues, so an event that used to be rare can become routine.
Water stress lowering the drought threshold: a site that once absorbed a dry summer without disruption can see a moderate drought disrupt water-dependent operations once chronic water stress has already reduced the margin.
Rising average temperature lowering the heatwave threshold: as average summer temperatures climb, a heatwave that once passed without incident can push a site past a safety or equipment threshold it previously stayed under.
Coastal erosion lowering the storm surge threshold: gradual coastal erosion can mean a storm surge that caused no damage a decade ago now reaches further inland.
Why do fewer organisations track chronic hazards than acute ones?
Chronic hazards get tracked less often because they rarely trigger the systems built to catch acute ones: no insurance claim, no incident report and no maintenance ticket puts chronic risk on anyone's radar.
Chronic hazards rarely supply a trigger event: an insurance claim, a damaged roof or a closed store all start with something happening on a specific day; a few centimetres of coastal erosion or a slow rise in water stress never does.
Reporting structures follow acute risk: incident logs, insurance renewals and disaster recovery plans are all built around discrete events, so chronic change has nowhere obvious to get recorded.
Budget cycles reward the wrong horizon: annual facilities reporting suits a cost that appears in one financial year, not one that accumulates gradually over five or ten years.
No single role is responsible for spotting it: an acute incident lands on whoever manages the site that day, while a slow shift such as rising water stress touches facilities, sustainability and finance all at once, without ever landing squarely on one of them.
None of these obstacles are permanent, and skipping them doesn't make the cost disappear. It only delays when someone finds out about it, typically at a site sale, a refinancing or an insurance renewal, by which point there is far less room to plan around it.
Each obstacle has a practical fix:
Replace the missing trigger event with continuous monitoring. Platforms such as SmartResilience track site-level hazard exposure on an ongoing basis, so a slow shift in water stress or coastal erosion surfaces on a scheduled review rather than needing an incident to reveal it.
Give chronic hazards a line in the reporting structures acute risk already has. Add a chronic-hazard indicator to the same incident log, facilities report or disaster recovery plan acute events already feed, so the data has somewhere to be recorded.
Extend the budget horizon chronic hazards get judged against. Model the cost over five to ten years rather than a single financial year, so a chronic hazard competes for attention on the same terms as an acute loss.
Assign clear ownership for chronic hazard tracking. Give one named role, whether in facilities, sustainability or finance, responsibility for reviewing chronic indicators on a set schedule, so it isn't left to whichever team happens to notice first.
Practical tip: Track site-level utility costs, cooling spend and insurance renewal terms year over year, not just incident reports, since that is where a chronic hazards’ costs actually surface first.
How do you compare hazard risk consistently across sites?
You compare hazard risk consistently across sites by scoring every site and division against the same hazard categories, rather than letting each one define its own. Skip that step, and site-to-site comparisons, group-level roll-ups and adaptation rankings all stop meaning what they claim to.
In practice, that comparison happens in five steps:
Step 1 - Adopt one hazard taxonomy across every site. Use the same list, such as the EU Taxonomy's 28 hazard types split into acute and chronic risk, everywhere, rather than letting each site or division invent its own labels for the same event.
Step 2 - Score every site against that taxonomy the same way. Apply one consistent method for rating likelihood and severity, whether a simple scale or a full hazard, exposure and vulnerability assessment, so a "high risk" flood score means the same thing at every site.
Step 3 - Log incidents and costs against the shared categories, not a local shorthand. When a wind event closes a site, record it as the wind hazard the taxonomy defines rather than a locally invented label such as "roof repair," so the history still maps back to the same list a decade later.
Step 4 - Roll scores up to group level using that same taxonomy. Consolidate site-level scores by hazard category for group reporting and IFRS S2-aligned disclosure, the International Sustainability Standards Board's (ISSB) climate reporting standard, so the portfolio figure represents real exposure rather than whichever division reported most thoroughly.
Step 5 - Rank sites for adaptation spend from the consolidated score, not the paper trail. Use that same consistent figure to decide which sites get investment first, so the ranking reflects actual risk rather than which site happens to keep the most detailed local records.
Practical tip: Use the same 28-hazard list as the incident-logging categories at every site, not a local shorthand, so a head office review can roll up exposure without re-mapping each site's terms first.
Once hazards are categorised consistently, the next step is running an actual site and portfolio physical risk assessment, which converts a categorised hazard list into a financial exposure figure for each site.
How SmartResilience helps you assess hazard exposure across your portfolio
Categorising hazards correctly only pays off once it feeds into an assessment of what each hazard actually costs at each site. SmartResilience assesses acute and chronic hazard exposure, including flood, heat, wind and water stress, at site and portfolio level, using a documented methodology, and for flood and wind specifically, converts that exposure into a financial figure rather than a category label.
Portfolio-wide hazard scoring: every site is scored against the same hazard categories, so a facilities team can compare exposure across an estate of any size on one consistent basis.
Site and portfolio-level financial output: hazard exposure converts into figures such as annualised loss and probable maximum loss, not a generic risk rating.
Auditable, exportable methodology: the data lineage behind every hazard score is documented and can be exported directly to an external auditor.
A FTSE 100 client used this approach to move from black-box consultancy outputs to a transparent, auditable hazard methodology for EU regulatory compliance, replacing a report stakeholders took on faith with one they could check line by line.
SmartResilience
See SmartResilience in action
Book a free demo tailored to your organisation and assets.
Book a free demoFrequently Asked Questions (FAQs)
Where do you get the data to score a site against all 28 hazard types?
Government sources cover some of this already, flood maps and climate projections from the Environment Agency and Met Office, for example, but resolution and coverage vary by hazard. A site-level physical risk assessment brings these together into one comparable score per hazard.
Do you need to track all 28 hazards, or just the ones relevant to your sites?
Most UK multi-site estates only need four or five hazards in practice, usually flood, heat, wind and water stress. Checking the full 28-item list first confirms nothing relevant to a specific sector or region gets missed before narrowing it down.
Can a hazard be both acute and chronic?
No single hazard sits in both categories under the EU Taxonomy, but related pairs exist, heat wave (acute) and heat stress (chronic), for example, and the chronic version typically raises the baseline that makes the acute version more damaging.
How often should hazard exposure be reassessed once it's categorised?
The categories themselves rarely change, but exposure does, since chronic hazards shift the baseline gradually. An annual review is a reasonable minimum, with a fresh look after any site acquisition, major weather event or update to regional climate projections.
What's the first step to fixing inconsistent hazard categorisation across sites?
Agree one shared hazard list across every site, ideally the same 28 categories referenced throughout this guide, and require every new incident or cost report to use it. Retrofitting historical records can wait; consistency going forward matters more than a perfect backdated dataset.
Does getting hazard categorisation right change anything for insurance or IFRS S2 disclosure?
Yes. Insurers increasingly ask for hazard-specific evidence rather than a general risk narrative, and IFRS S2 disclosure requires physical risk broken down by hazard type rather than reported as one blended figure. Consistent categorisation makes both conversations easier to evidence.