
Introduction
Most sustainability and risk teams can already point to a handful of sites in their estate that flood, lose power in a storm or shut down when a heatwave pushes cooling systems past their limit. What most teams cannot yet do is put those numbers on a consistent footing: what these events cost on an annualised, comparable basis across sites, what it would cost in ten years under a warmer climate, or which site should get investment first.
That gap between having isolated loss figures and having a financially comparable, forward-looking risk assessment is where most physical climate risk work stops short.
What is physical climate risk?
Physical climate risk is the potential for financial loss, operational disruption or asset damage that climate hazards such as flooding, extreme heat, high wind, water stress and wildfire cause directly and indirectly to a business.
In practical terms, this shows up as:
Stock loss and business interruption when a site cannot operate during or immediately after an event
Repair costs and insurance excess once the event has passed
Rising operating costs from chronic change: cooling, water sourcing and climbing insurance premiums
An aggregate exposure that is easy to underestimate, because site teams often expense weather losses locally and may not report them upward to group level
It sits alongside transition risk, which covers the financial exposure created by the shift to a low-carbon economy, such as changing regulation, carbon pricing or shifting customer demand. This guide focuses on physical risk specifically. For the full distinction between the two categories, see our guide to Understanding Physical vs. Transitional Climate Risks.
What are acute and chronic physical risk?
Physical risk splits into two categories: acute risk from sudden, discrete events, and chronic risk from gradual, long-term change.
Acute risk: flash floods, windstorms, heatwaves and wildfires, where the damage, the closure and the repair bill all tie to a single date
Chronic risk: rising sea levels, gradually increasing average temperatures and long-term water stress, which erode asset value and raise operating costs over years rather than in a single event
How the two compound: chronic change raises the baseline against which acute events occur, so what used to be a rare acute event could become a routine one. For example, a site that flooded every twenty years might now flood every two.
A sustainability or facilities team can only compare acute and chronic risk consistently across dozens of sites if site teams log incidents and track asset value and operating costs the same way everywhere. Chronic risk especially rarely produces an incident report, so a team only sees the shift once it tracks the data consistently over multiple years across the whole estate, rather than comparing year on year within one site.
What is the hazard, exposure and vulnerability framework?
Most established frameworks for assessing physical risk, including the one behind current financial disclosure standards, describe risk as a function of three components: hazard, exposure and vulnerability.
The three components break down as:
Component | What it captures |
Hazard | The climate event itself, such as a flood, storm, heatwave or drought, and its probability and severity under current and future climate scenarios |
Exposure | What sits in the path of that hazard: the location, value and operational role of a site, its people and its assets |
Vulnerability | How much damage the hazard actually causes once it reaches an exposed site, shaped by building standards, flood defences, cooling capacity, backup systems and how quickly a team can respond |
This three-part structure, set out in the IPCC's Sixth Assessment Report, is the starting point for any credible assessment. It is not, on its own, the finish line.
How do you assess physical risk at site and portfolio level?
Assessing physical risk starts with the hazard, exposure and vulnerability framework above, then continues into financial quantification, which turns climate data into something a finance team can act on.
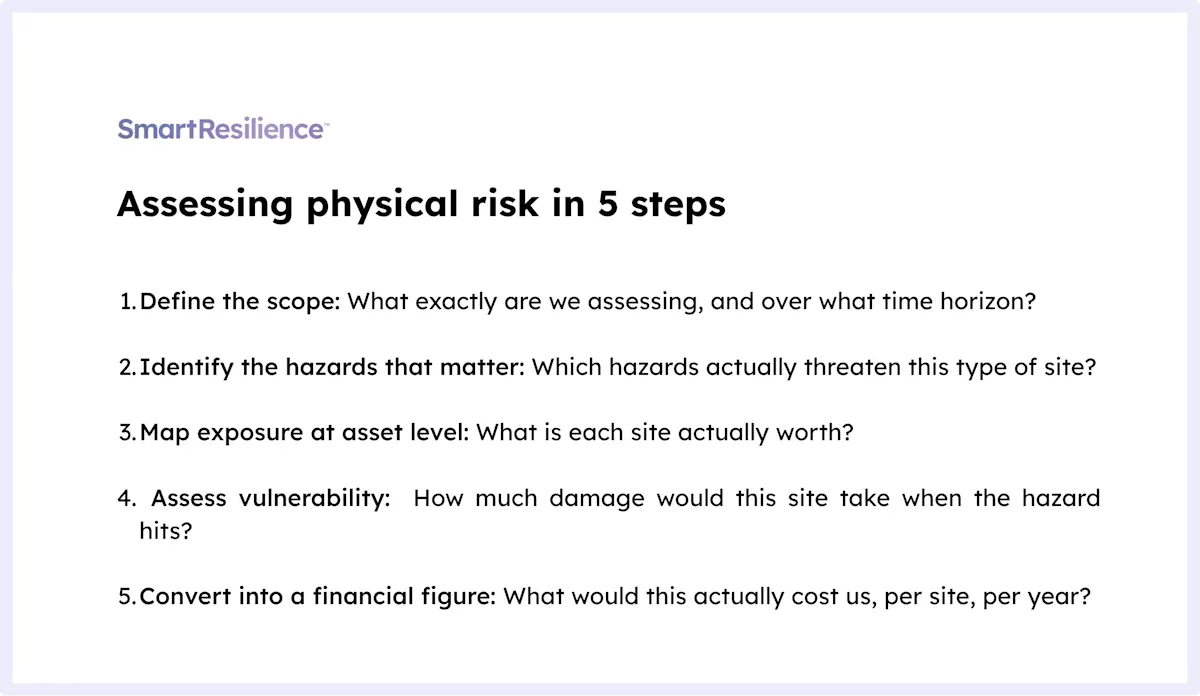
Here are the key five steps to asses physical risk at site and portfolio level:
Define the scope.
Decide whether the assessment covers a single site, a full estate or a specific set of high-value locations, and whether it looks at current risk, a future climate scenario or both.
Identify the hazards that matter.
Match hazard types to site type rather than running every model everywhere. A coastal distribution centre needs storm surge and sea-level rise modelling, while an inland manufacturing site needs heat and water stress modelling instead.
Map exposure at asset level.
Geolocate every site and attach a value such as replacement cost or revenue generated, pulled from the existing asset register or property management system rather than rebuilt from scratch. This step turns a list of addresses into a list of financial stakes.
Assess vulnerability.
Start with each site's building standards, drainage, backup power, insurance cover and the warning time a site manager gets before an event reaches it. A site survey or facilities audit is usually the source for this, since head office rarely holds this level of site-specific detail.
Convert the assessment into a financial figure.
Turn the first four steps into an annualised expected loss per site, the estimated cost of a 1-in-100-year event and how that figure shifts under different climate scenarios. This is the number a CFO can put next to any other capital decision, which is why it turns a hazard assessment into a funded adaptation plan rather than a filed report.
IIGCC's Physical Climate Risk Appraisal Methodology (PCRAM) maps each step above directly to the outputs IFRS S2 (the international sustainability standard covering climate-related disclosures), CSRD (the EU's Corporate Sustainability Reporting Directive) and UK SRS (the UK Sustainability Reporting Standards) require, instead of leaving quantification as a separate exercise done afterward.
Our PCRAM and CRIF guide walks through the methodology step by step, and Scenario Analysis for Climate Resilience covers how to model hazard frequency and severity under different future emissions pathways in more depth.
A team that stops at step four knows where risk sits across their estate. Only by completing step five do they know whether it is worth acting on.
How do you assess risk across a multi-site portfolio?
A team assessing risk across a multi-site portfolio applies one consistent methodology everywhere, then directs the deepest analysis at the sites that matter most.
In practice, that means:
A tiered scoring approach.
Every site gets a comparable rating from the same baseline model, run consistently across the portfolio, so a team can quickly identify which sites carry the highest risk before committing budget to deeper analysis.
One methodology across divisions.
Teams in a manufacturing division and a retail division produce a comparable group-level view instead of two incompatible risk reports, because both teams use the same scoring criteria and data sources rather than each
building its own approach in isolation.
The most detailed, most expensive modelling reserved for the sites that matter most.
Once a site scores as highest-risk or highest-value in that first pass, a team brings in higher-resolution local hazard models where they exist and refines assumptions against whatever local data is available, rather than running the expensive analysis on every site from the start.
Site surveys reserved for genuine uncertainty.
A team commissions a physical site survey only for the handful of locations where real uncertainty remains even after the higher-resolution modelling, rather than surveying the whole estate as a default step.
Hazard data resolution varies by market. A team using the tiered approach brings in the best available local model for a flagged site regardless of how granular that data is, rather than assuming every market can be assessed to the same level of detail from day one.
How do you rank adaptation measures once risk is quantified?
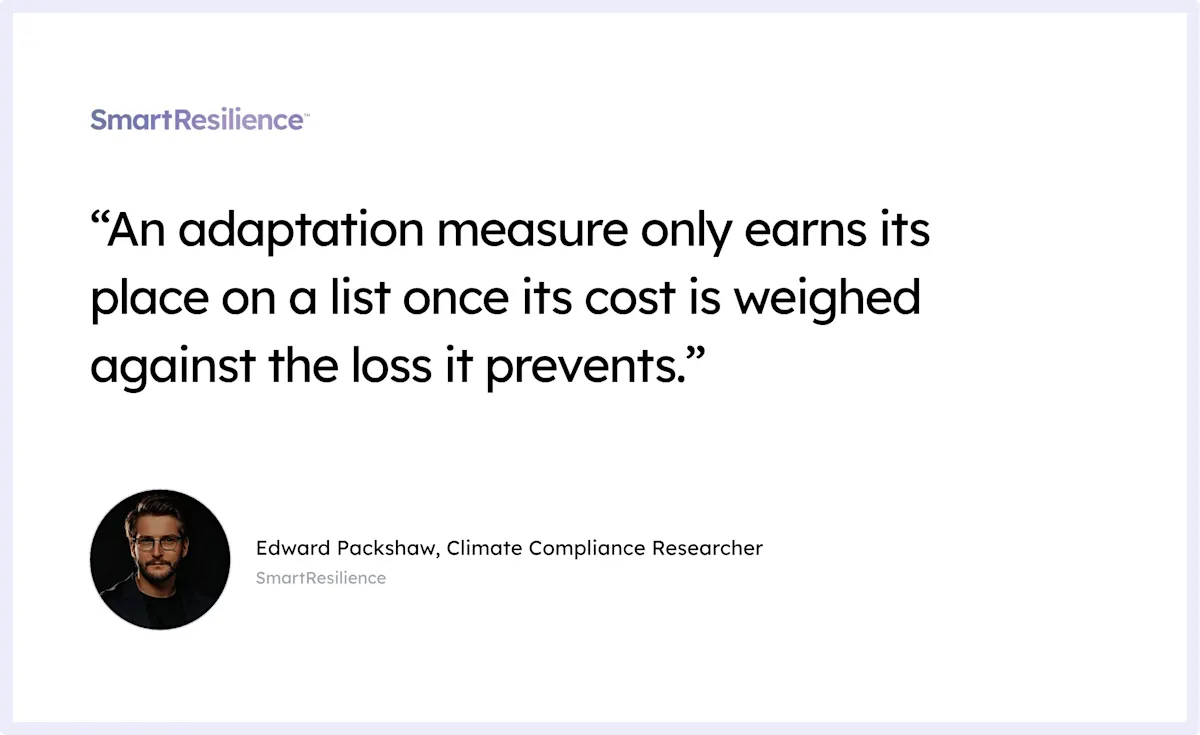
Once a site's financial exposure is known, ranking adaptation measures by return on investment answers the "what next" question better than a generic list of categories.
A typical assessment surfaces:
Physical hardening: flood barriers, elevated equipment and similar site-level defences
Operational changes: backup power and rerouted deliveries during a warning period
Financial measures: adjusted insurance cover and capital reserves for repair costs
A cost-benefit ranking across all three, comparing avoided loss to cost for each specific site, so the list becomes a decision instead of a menu
A quantified, site-specific assessment also strengthens an insurance renewal conversation more than a generic flood map, particularly as insurers tighten terms and raise excesses on climate-exposed sites. Sector context shapes which measure matters most: a manufacturer usually protects against production downtime, a retailer against store closures and stock loss across many smaller sites and a real estate owner against asset value and acquisition screening. The team closest to a specific site, not a general rulebook, should have the final say on which measure to prioritise first, since the judgment a decision like that needs varies by sector and by team. Evaluating flood risk across a multi-site estate covers flood-specific adaptation planning in more depth.
What makes a physical risk assessment audit-ready?
A physical risk assessment is audit-ready when an external assurer can trace every output back to its underlying data and methodology, rather than taking the final number on trust.
An assessment earns that status when:
The team documents where hazard data came from, so an assurer can see exactly where the numbers originated
The team shows exposure and vulnerability inputs for each site, rather than summarising them into a single opaque score
A change log exists for every update to a site's rating
Outputs map directly to a named regulation's requirements, not a narrative description of risk
IFRS S2 and UK SRS both expect quantified, evidenced physical risk disclosure where material and feasible, with a documented explanation where it isn't(the Task Force on Climate-related Financial Disclosures) built much of the framework these newer standards now use, before formally disbanding once its recommendations were folded into IFRS S2 in 2023, according to the IFRS Foundation. TCFD to UK SRS S2: Closing the Physical Risk Evidence Gap covers what evidence base UK SRS specifically requires and by when.
How SmartResilience helps you assess physical climate risk
Sustainability and risk teams responsible for a multi-site estate need one methodology that produces both a site-level financial figure and a defensible audit trail, applied consistently across every site and division.
Teams using SmartResilience Climate Assessments get:
PCRAM run across every site in a portfolio, returning a financial figure per site instead of just a score still waiting to be interpreted and costed out
Adaptation measures ranked by return on investment
An assessment that updates as the portfolio changes: when a team adds a new site or the portfolio's asset values change, that shows up in the numbers straight away, rather than waiting for next year's review.
Sainsbury's used this approach across more than 1,000 sites to identify flood exposure ahead of an event that would otherwise have cost an estimated £3m in damage. Group 1 Automotive brought flood risk under control across more than 150 UK sites using the same methodology, and Meadow Foods built climate resilience into a food ingredients business, where a single supply disruption carries knock-on costs across the wider operation.
What should your team do next?
The next physical climate risk assessment your team runs is a chance to build the financial conversion step in from day one, instead of treating it as a separate project once the hazard data is already in.
Let us show you how this can be done for your portfolio.
SmartResilience
See SmartResilience in action
Book a free demo tailored to your organisation and assets.
Book a free demoFAQs
What is physical climate risk? Physical climate risk is the potential for financial loss, operational disruption or asset damage caused directly and indirectly by climate hazards such as flooding, extreme heat, wind, water stress and wildfire, as distinct from transition risk, which comes from the shift to a low-carbon economy.
What are the two types of physical climate risk? Acute risk comes from sudden, discrete events like floods and storms. Chronic risk comes from gradual, long-term change like rising average temperatures, sea-level rise and long-term water stress.
What is the difference between physical and transition risk? Physical risk is damage and disruption from climate hazards themselves. Transition risk is financial exposure created by the move to a low-carbon economy, such as new regulation, carbon pricing or shifting customer demand.
How do you quantify physical climate risk financially? By converting a site's hazard, exposure and vulnerability data into a financial figure, typically an annualised expected loss or the estimated cost of a 1-in-100-year event, rather than stopping at a qualitative risk rating.
What data is needed for a physical climate risk assessment? Hazard data (historical events and future climate projections), exposure data (site locations, asset values, revenue and dependencies) and vulnerability data (building standards, defences, backup systems and response times).
How does scenario analysis fit into a physical risk assessment? Scenario analysis models how hazard frequency and severity might change under different future emissions pathways, which lets an assessment show how a site's risk changes over time rather than only reflecting current conditions.
What does physical climate risk look like across different sectors? Manufacturing exposure tends to centre on production downtime and equipment damage. Retail exposure tends to centre on site closures and stock loss across many smaller locations. Real estate exposure tends to centre on asset value and acquisition screening.
What makes a physical risk assessment ready for external audit? A clear, documented methodology, evidenced exposure and vulnerability inputs for each site, a change log when ratings update and outputs mapped directly to what a specific regulation, such as IFRS S2 or UK SRS, requires.