

A hospital estates team runs a World Health Organization (WHO) vulnerability check or completes the NHS Climate Change Risk Assessment (CCRA) Tool, and learns exactly which wards flood and which plant rooms lose power in a heatwave. What they don't get is a number. Finance wants to know what a flooded pharmacy costs, and an auditor wants the methodology behind that cost, not just the rating that produced it. Getting from a checklist to that figure takes five steps.
How does a healthcare climate risk assessment differ from a standard WHO or NHS checklist?
A healthcare climate risk assessment differs from a WHO or NHS England checklist in what it produces at the end: a modelled financial figure and an audit trail, rather than a hazard rating alone. WHO's checklists and NHS CCRA Tool are not built to fall short here. They are built to answer a clinical-vulnerability question well, and they do. A financially quantified assessment answers a different, later question: what does that vulnerability cost, and what does fixing it justify spending.
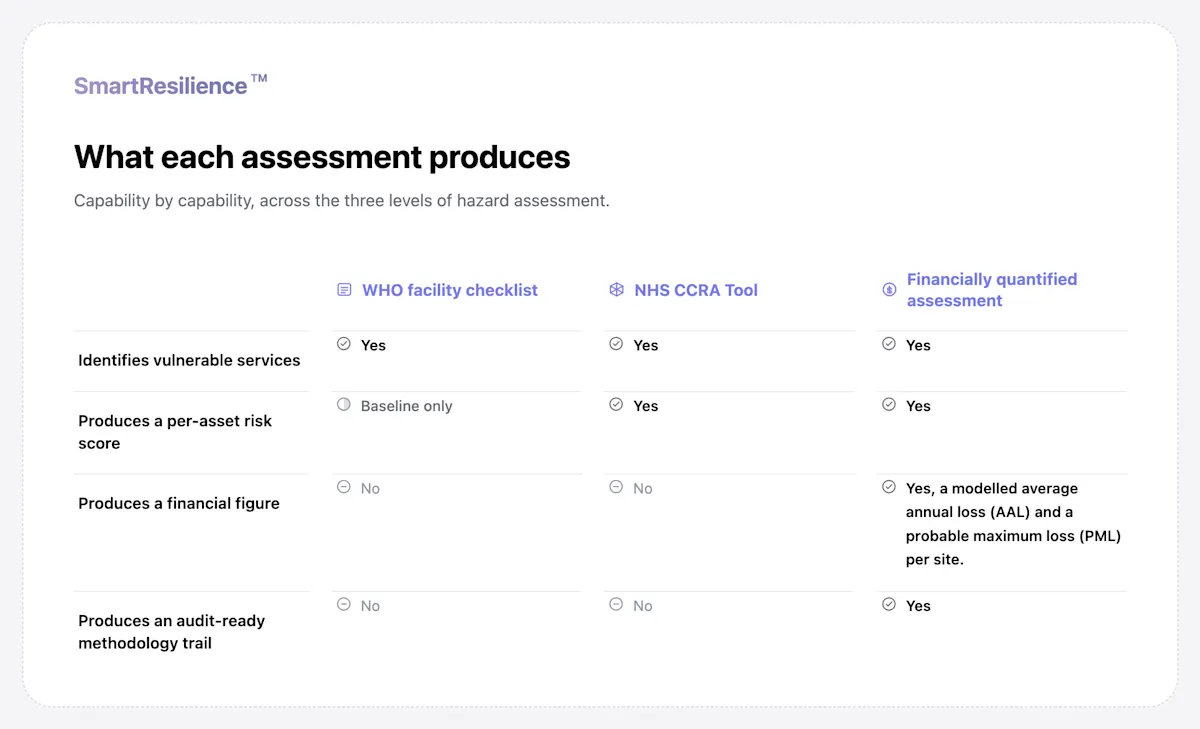
Neither gap is a flaw in WHO's or NHS England's own tools. A facility manager still needs the vulnerability baseline before anyone can model a financial figure from it, and the financial step depends entirely on that vulnerability work being right first. The difference only shows up in what happens after the checklist is filed: whether the estates team walks into a budget meeting with a number, or only with a rating.
type: embedded-entry-inline id: 5oQQLqr3606KEpXnFNoM8R
What climate hazards matter most for hospitals and care facilities?
Flood, heat and water stress carry the sharpest continuity-of-care consequences for hospitals and care facilities, ahead of wind in most UK healthcare estates. This is the first of the five steps below. Look for:
Flood: Ground-floor plant rooms, pharmacies and medical gas stores sit at the depths UK flood models actually test, and a flooded plant room can take an entire ward offline rather than just the room it sits in. Losing power or oxygen supply mid-admission is a different category of consequence to losing a car park for a day.
Heat: Care homes and wards with limited mechanical cooling see the sharpest resident and patient risk, since medication storage and vulnerable occupants both have narrow temperature tolerances. England recorded 2,803 excess deaths among people aged 65 and over during the 2022 summer heat-periods, the highest since heat mortality monitoring began in 2004, and a cooling failure during a heatwave can force a temporary transfer of residents that most care homes have no rehearsed process for.
Water stress: Sterilisation, cooling and basic hygiene capacity all depend on water supply, and chronic water stress is a slower-moving risk than flood or heat that shows up in long-term capital planning rather than a single event. An estates team tracking only acute hazards can miss a site heading toward a supply constraint years before it becomes a crisis.
Wind: Storm-force wind events happen less often than flood or heat across most UK healthcare estates, but recovery time matters when a damaged roof or a downed power line takes a facility offline for days rather than hours. Backup generators sized for a flood scenario do not always cover a multi-day wind-driven power outage.
These hazards also compound on staffing, not just estate condition. A heatwave that raises patient and resident risk on the wards can simultaneously disrupt the travel routes staff rely on to reach a hospital or care home for a shift, and when extreme heat closes local schools, staff without childcare cover are pulled from the rota at the same moment clinical demand and cooling failures both peak.
How do you map exposure and vulnerability across a healthcare estate?
Mapping exposure and vulnerability across a healthcare estate means scoring exposure and vulnerability separately for each asset, then layering continuity-of-care factors on top, following the same hazard-exposure-vulnerability framework that applies to any physical asset. This is the second step. In practice, that means:
Exposure at asset level: A hazard map shows what sits in a flood plain or a heat corridor at the level of an individual building, not an estate-wide average that hides one vulnerable site among many low-risk ones. Two sites a mile apart on the same trust's estate can carry entirely different exposure.
Vulnerability at asset level: The same flood depth means something different to a car park than to a plant room holding backup power, so vulnerability gets scored by asset type, not by hazard alone. A plant room and a car park at identical flood depth carry very different consequences.
Continuity of care mapped alongside both: Backup power, medication cold chains and patient transfer capacity each need their own line in the assessment, because a facility can sit inside a flood plain on a map and still keep functioning if those three hold. Mapping the hazard without mapping these three tells an estates team where the water goes, not whether care continues.
How do you turn hazard exposure into a financial figure?
Turning hazard exposure into a financial figure means attaching a modelled cost, not just a rating, to every site a hospital or care home depends on, following the same PCRAM and CRIF methodology used across other multi-site estates. This is the third step, and the one that separates a checklist from a financially quantified assessment. What good looks like:
A modelled average annual loss (AAL): Every site gets one expected annual cost, not a five-point severity scale, so finance teams can compare a hospital against a care home on the same basis. That single figure is what turns a portfolio of ratings into a ranked list finance can act on, and it answers the question a budget conversation starts with: what should we expect to lose in a typical year?
A probable maximum loss (PML) at material return periods: A 1-in-100-year or 1-in-200-year figure lets a finance director weigh a rare but severe event against the cost of preventing it. Boards tend to ask about the tail event, not the average year, so both figures need to sit side by side, and PML is what answers their question: how costly would a really bad event be, at the plausible worst case?
A single methodology across every site: Using one modelled approach across every hospital, care home and clinic means the AAL and PML for a 1980s hospital and a newly built clinic sit on the same basis, so portfolio-wide comparisons hold up. Mixing methodologies site by site makes any estate-wide ranking unreliable.
A figure finance can challenge, not just accept: The assumptions behind AAL and PML need documenting well enough that a finance team can challenge them rather than accept a total on trust. A figure nobody can interrogate gets treated the same way a vague rating does.
How do you build an adaptation plan from the assessment?
Building an adaptation plan from the assessment means ranking measures by return on investment, prioritising the sites step three showed carry the highest expected loss. This is the fourth step. A flat, unranked list of measures forces a board to guess at priority, and guessing usually defaults to whichever measure is cheapest rather than whichever measure matters most. Questions to ask directly:
Which sites carry the highest expected loss: Adaptation spend gets sequenced against the AAL and PML figures from the financial-quantification step, not against which measures are simplest to install first. The site with the highest expected loss goes first, even if it is not the cheapest fix.
Which measures pay back fastest: Backup power, flood barriers and improved drainage each carry a different cost and a different return, and ranking them by return turns a list of options into a plan a board can approve. Two measures with the same upfront cost rarely carry the same payback period.
What happens if nothing changes: A credible adaptation plan states the cost of inaction alongside the cost of each measure, so a board sees a choice rather than a single recommendation. Naming the cost of doing nothing is what makes the spending case defensible rather than optional.
Practical tip: Sequence adaptation measures by the sites the financial-quantification step showed carry the highest expected loss, not by which measures are cheapest to install first.
What does audit-ready reporting look like for a healthcare estate?
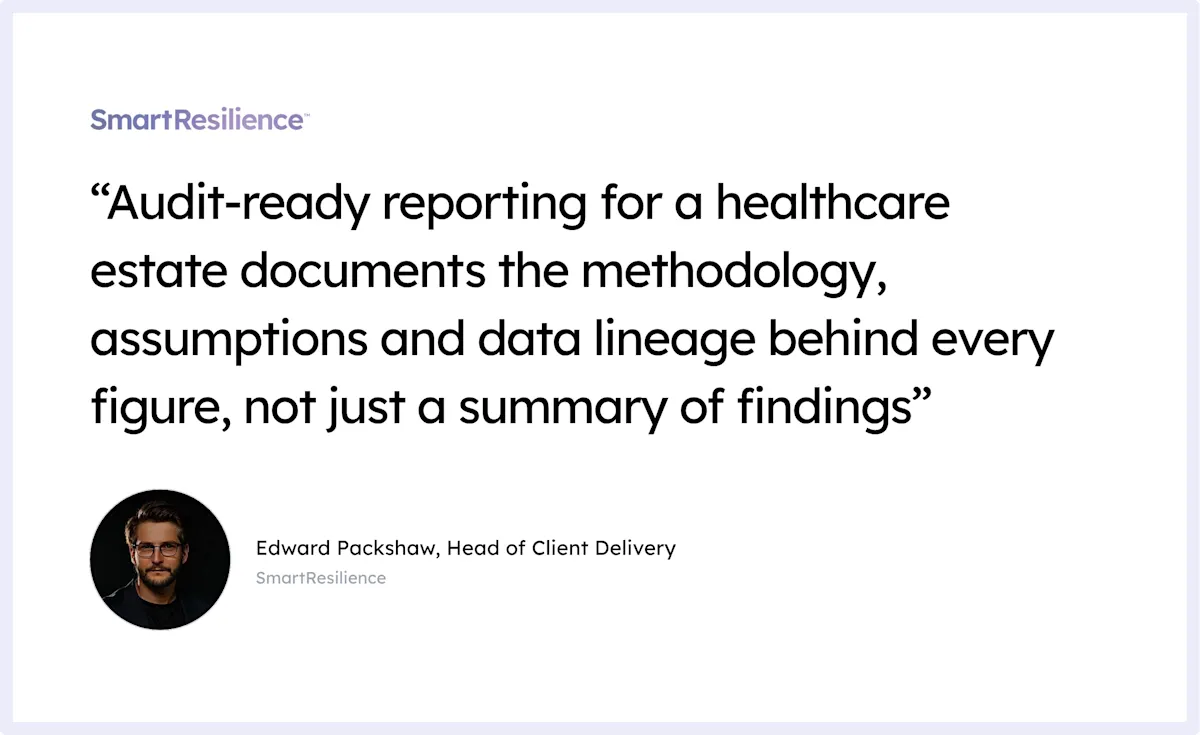
Audit-ready reporting for a healthcare estate documents the methodology, assumptions and data lineage behind every figure, not just a summary of findings. This is the fifth and final step. Get clear, written answers on:
What methodology produced each figure: A report needs to show the hazard data, the emissions scenario and the damage function behind every AAL and PML, not just the totals. An auditor should be able to trace any single figure back to the assumption that produced it.
What assumptions were made and why: Time horizons, asset values and vulnerability scores all rest on assumptions, and an auditor needs those stated rather than embedded silently inside a number. An assumption stated in a footnote survives scrutiny better than one buried in a spreadsheet nobody sees.
How the figure gets reviewed and updated: Hazard data and asset values both change, so a report needs a stated review cycle rather than a one-off snapshot filed and forgotten. A figure two years out of date invites the same challenge as one with no methodology behind it at all.
How do WHO, NHS CCRA and PCRAM fit together?
WHO's checklists, the NHS CCRA Tool and the Physical Climate Risk Assessment Methodology (PCRAM) answer three different questions rather than compete for the same one.
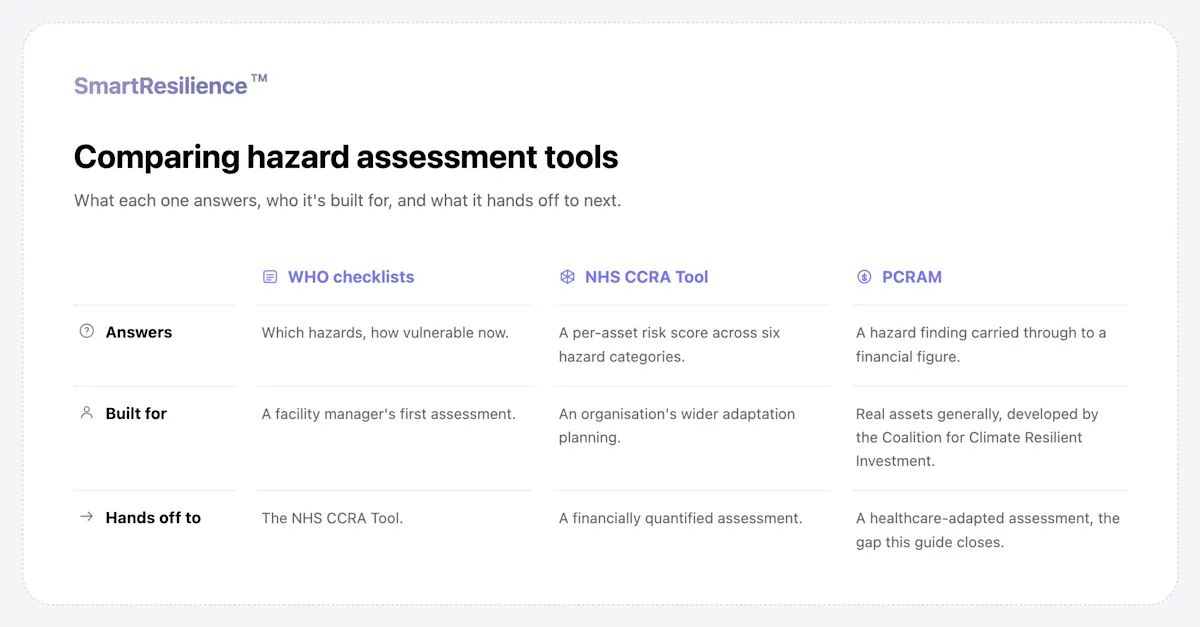
Treating the three as competitors misses the point that each hands off to the next, starting with a WHO baseline and ending with a financial figure built for healthcare specifically.
How SmartResilience helps you quantify physical climate risk across a healthcare estate
Most estates teams reach the same point after a first vulnerability check: a rating for every hospital, care home or clinic, and no figure a finance director will act on. SmartResilience Climate Assessments closes that gap for flood today, applied here to a healthcare estate, extending coverage to the remaining hazards as that work develops:
A financial figure per site: The platform reports an average annual loss and a probable maximum loss at material return periods for flood exposure today, with heat and water stress quantification in development, using one methodology across every hospital, care home or clinic in the estate.
Adaptation measures ranked by return: Estates teams see which measures, from backup power to flood barriers around plant rooms, pay back and over what period, so a capital request carries a number rather than a recommendation.
An audit trail behind every figure: An external auditor can trace the hazard data, the scenario and the assumptions behind each figure back through the platform, rather than take a summary on trust.
The same methodology already runs across other multi-site estates outside healthcare. Sainsbury's runs early warning across 1,000+ sites and avoided a £3m flood damage event, the kind of outcome a healthcare estate's finance director is asking the same question about: what would this event have cost, and what does preventing it justify spending.
SmartResilience
See SmartResilience in action
Book a free demo tailored to your organisation and assets.
Book a free demoWhat's next
The estates team that turns its next WHO or NHS CCRA check into a modelled financial figure is the one whose adaptation budget clears finance and survives an audit on the first pass, rather than going back for a second round of questions. That is the decision in front of any healthcare estate that has already run a vulnerability check and is now looking at what comes after it, and SmartResilience's guide to physical risk reporting sets out what a report built to survive that scrutiny actually contains.
FAQs
What are the steps in a physical climate risk assessment for a healthcare estate? Five steps: identify the climate hazards that matter most, map exposure and vulnerability at asset level, turn that exposure into a financial figure, build an adaptation plan ranked by return, and produce an audit-ready report documenting the methodology behind it.
How is this different from a standard NHS or WHO vulnerability checklist? A WHO checklist or the NHS CCRA Tool identifies which services are vulnerable to which hazards and produces a risk score. A financially quantified assessment carries that finding further, into a modelled AAL and PML an auditor can test.
What climate hazards does the NHS CCRA Tool cover? The NHS Climate Change Risk Assessment (CCRA) Tool is a downloadable tool that helps NHS trusts, system leaders and other NHS organisations identify climate-related risks specific to their operations, understand the potential impact on healthcare delivery, plan a response through identifying potential adaptations, progress toward NHS net zero commitments, and maintain service continuity during climate disruptions.
What climate hazards matter most for hospitals and care facilities? Flood, heat and water stress carry the sharpest continuity-of-care consequences in most UK healthcare estates, since they affect plant rooms, medication storage and basic hygiene capacity directly. Flood and heat are acute, sudden-onset hazards, while water stress is chronic and slower-moving, and the two categories of acute and chronic risk need different monitoring.
How do you turn a healthcare climate risk assessment into a financial and adaptation plan? Attach a modelled average annual loss and probable maximum loss to every site, then rank adaptation measures by return on investment against the sites carrying the highest expected loss.
What frameworks are relevant to a healthcare climate risk assessment, and how do they relate? WHO and the NHS CCRA Tool answer the vulnerability question. PCRAM answers the financial-quantification question. A healthcare-adapted assessment applies PCRAM's approach to the sector WHO and NHS CCRA already cover clinically.
Does a WHO or NHS CCRA checklist need to be completed before a financially quantified assessment? Yes. The financial step models cost against the vulnerability findings the checklist produces, so it needs that baseline as an input rather than replacing it. Skipping the checklist leaves the financial model with nothing to quantify.