
A sustainability team at a multinational manufacturer commissions a climate risk assessment for its European division. Another division runs its own in Southeast Asia a year later. A third has never run one at all. Each report uses a different hazard model, a different time horizon and a different way of stating risk, and conflicting regional disclosure rules make reconciling them harder still. But the sharper problem sits underneath that inconsistency: an average risk score across the estate can look comfortably low while missing the one single-source plant or supplier whose loss would halt the entire production line, not just its own site. Getting from three divisional reports to one group-level number that surfaces that kind of concentrated risk is a five-step process, not a difference in which vendor each division picked.
What is a physical climate risk assessment for manufacturing?
A physical climate risk assessment for manufacturing is the process of turning physical climate risk, the chance that a specific flood, heatwave, storm or water shortage damages a specific factory, warehouse or supplier, into a modelled financial figure for every site a manufacturer depends on. A hazard rating tells a facilities team that a plant sits in a flood zone. It does not tell a finance director what that flood would cost, how that cost compares to the plant down the road, or whether the money is better spent on a backup generator or a drainage upgrade.
That gap is why manufacturers run a full assessment rather than stopping at a hazard rating, using a consistent methodology such as the Physical Climate Risk Assessment Methodology (PCRAM) to convert a raw hazard score into a number a board can act on.
A hazard rating versus a modelled cost: A flood-zone flag or a heat-corridor map tells you something is exposed. It stops short of the modelled cost a board needs to compare one site against another.
A number, not a label: An assessment produces a modelled cost per site, the same kind of figure your finance director already uses to weigh any other capital decision.
What you don't own, not just what you do: A single-source supplier's exposure matters as much as a factory's, because either one going offline can stop the same production line.
One methodology, not whichever consultancy a division hired last: Comparable figures only exist if every site, in every division, gets measured the same way.
What are the steps in a physical climate risk assessment for a manufacturing business?
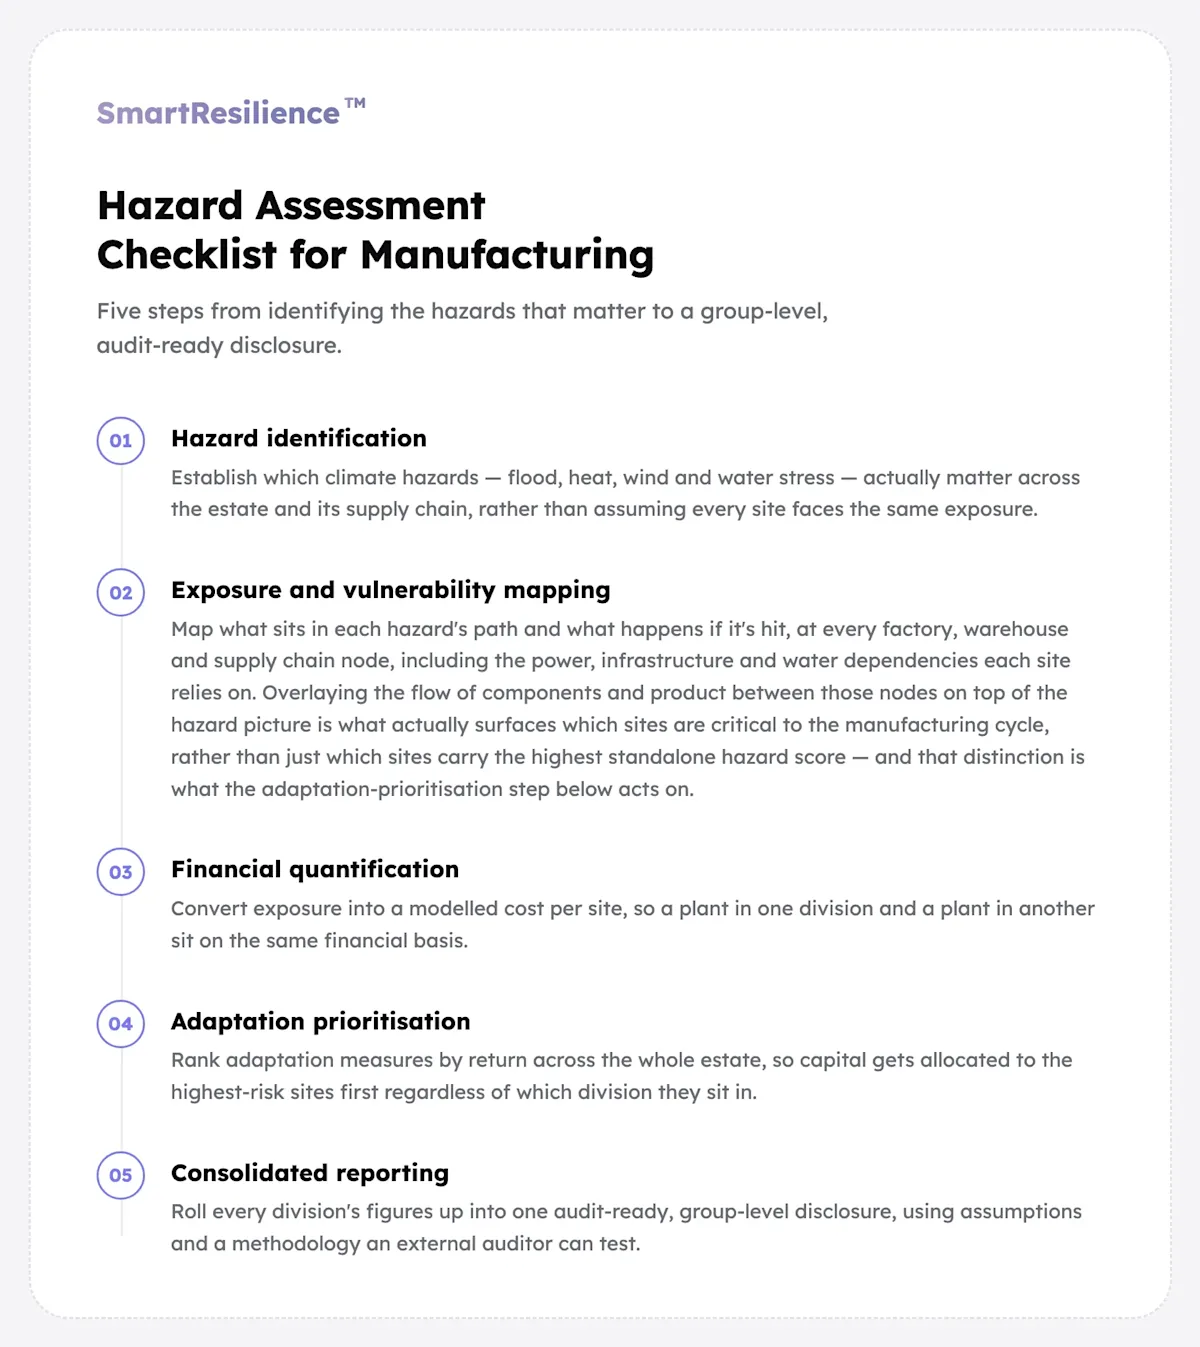
A physical climate risk assessment for a manufacturing business runs through five steps, following the same hazard-exposure-vulnerability-to-financial-figure framework that applies to any physical asset, extended here across a full estate and its supply chain. The steps stay the same whether one division runs the assessment or twenty do, which is exactly what makes group-level comparison possible in the first place. The five steps are:
Hazard identification: Establish which climate hazards, flood, heat, wind and water stress, actually matter across the estate and its supply chain, rather than assuming every site faces the same exposure.
Exposure and vulnerability mapping: Map what sits in each hazard's path and what happens if it's hit, at every factory, warehouse and supply chain node, including the power, infrastructure and water dependencies each site relies on. Overlaying the flow of components and product between those nodes on top of the hazard picture is what actually surfaces which sites are critical to the manufacturing cycle, rather than just which sites carry the highest standalone hazard score, and that distinction is what the adaptation-prioritisation step below acts on.
Financial quantification: Convert exposure into a modelled cost per site, so a plant in one division and a plant in another sit on the same financial basis.
Adaptation prioritisation: Rank adaptation measures by return across the whole estate, so capital gets allocated to the highest-risk sites first regardless of which division they sit in.
Consolidated reporting: Roll every division's figures up into one audit-ready, group-level disclosure, using assumptions and a methodology an external auditor can test.
The UK's third Climate Change Risk Assessment names industrial estates and their supply chains among the least assessed parts of the UK economy, which is one reason a consistent, estate-wide process matters more than another single-division report.
What climate hazards matter most across a manufacturing estate, from factories to supply chain nodes?
Flood, heat, wind and water stress each carry distinct consequences for a manufacturing operation, and those consequences extend past the factory gate to the suppliers and logistics routes a manufacturer depends on but does not own.
Look for:
Flood: A flooded assembly line stops production, not just one building, and Environment Agency flood mapping shows this risk concentrating on specific low-lying industrial sites rather than spreading evenly across an estate. A single-source supplier in a flood plain can halt a production line just as effectively as a flooded factory of your own.
Heat: Extended high-temperature periods, tracked in the Met Office's UKCP18 climate projections, reduce workforce output on the factory floor and push cooling and refrigeration equipment toward failure at the point it is most needed. This is a chronic, slow-building risk rather than a single event, and it shows up first as a productivity cost, not a damage claim. Heat stress is a direct health and safety risk as well as a productivity one: HSE guidance links rising heat exposure to lapses in concentration, slower reaction times and higher accident risk on the factory floor. Manufacturers managing this operationally often add staff to hot-zone shifts and rotate workers through the highest-heat areas more frequently, so no individual carries a full shift's exposure alone.
Wind: Storm-force wind events damage roofing, signage and exposed plant equipment, and recovery time matters more than the event itself when a damaged roof takes a production line offline for days rather than hours. A chronic-versus-acute hazard distinction helps here, since wind is acute and needs a different response plan to a slow-moving hazard like water stress.
Water stress: Water-intensive processes, such as cooling, cleaning and certain production stages, depend on a reliable water supply, and water stress builds over years rather than arriving as a single event. A site with no acute hazard exposure can still be heading toward a supply constraint that only shows up in long-range capital planning.
How do you map exposure and vulnerability across factories, warehouses and supply chain sites together?
Mapping exposure and vulnerability across a manufacturing estate means working through three tiers in sequence, rather than treating a manufacturer's own factories as the whole estate. A single estate-wide average hides the one vulnerable plant among many low-risk ones, and that framing misses where exposure often concentrates fastest: in the supply chain, not the owned sites. In practice, you work through it in three steps:
Map your owned factories and warehouses first.
Score exposure and vulnerability per asset, not per division, because a 1990s production facility and a newly built distribution centre carry very different vulnerability even sitting on the same flood map.
Extend the same scoring to your supply chain nodes.
A tier-1 supplier's site raises the same hazard exposure question as your own factory, but you'll usually have far less visibility into it, which is exactly where dual-sourcing decisions need to get made weeks ahead of a failure rather than after one. Knowing which supplier sites are exposed ahead of time is also what lets you act the moment a hazard materialises, rather than starting from scratch once the disruption has already hit.
Check the operational dependencies underneath both.
Power, infrastructure and water each need their own line in the assessment, because a site can look structurally sound on a hazard map and still fail if the grid connection, the access road or the water source it depends on gets disrupted.
The table below sets out how each dependency typically plays out, and which estate tier feels it most.
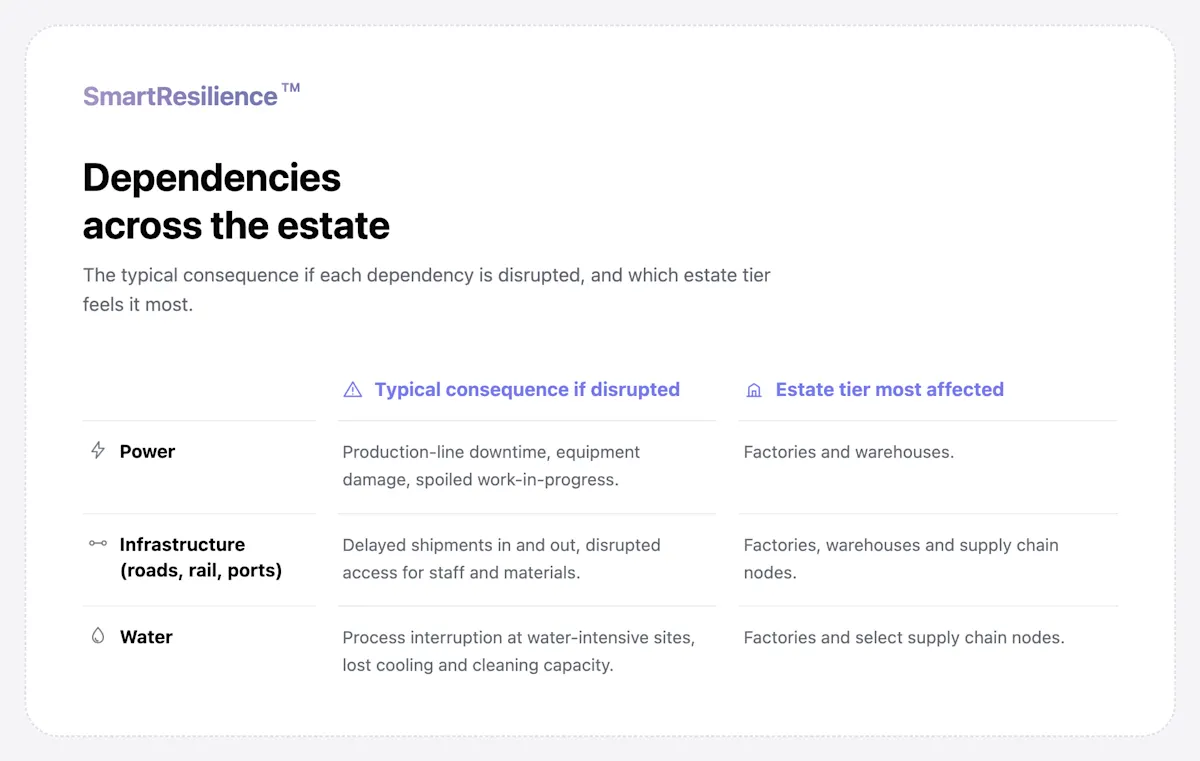
Key takeaway: A hazard map shows which sites sit in a flood plain. It does not show that a structurally sound plant next door goes offline anyway, because its power feed runs through the one substation that floods.
How is financial exposure quantified per site, not just as an estate-wide average?
Financial exposure gets quantified per site by modelling an expected cost for each factory, warehouse and material supply chain node individually, using the same Physical Climate Risk Assessment Methodology (PCRAM) applied across other multi-site estates. An estate-wide average tells a board nothing useful, since it blends a high-value plant with moderate exposure into the same number as a lower-value site with severe exposure. What good looks like:
A modelled average annual loss (AAL) per site: Every factory, warehouse and material supplier gets one expected annual cost, on the same basis, so a board can rank sites against each other rather than read a stack of unrelated hazard scores.
A probable maximum loss (PML) at material return periods: A 1-in-100-year or 1-in-200-year figure lets finance weigh a rare but severe event, a flood that takes a key plant offline for weeks, against the cost of preventing it.
One methodology across every division: Using the same modelled approach everywhere means a plant in one division and a plant in another sit on the same financial basis, which is the only way a group-level ranking holds up.
A figure finance can challenge, not just accept: The hazard data, the emissions scenario and the damage function behind every AAL and PML need documenting well enough that a finance team can challenge the number rather than accept a total on trust.
How does a manufacturer prioritise adaptation spend across a multi-division estate?
A manufacturer prioritises adaptation spend across a multi-division estate by ranking every measure, at every site, by return on investment (ROI) on one shared scale, rather than letting each division build its own business case in its own terms. A flat, division-by-division list of recommended measures forces a board to compare unlike things and usually defaults capital to whichever division argued loudest, not whichever site carries the most risk.
Questions to ask directly:
Which sites carry the highest expected loss, across every division?
Adaptation spend gets sequenced against the AAL and PML figures from the financial-quantification step, compared across the whole estate rather than within one division's own ranking.
Which measures pay back fastest?
Flood barriers, backup power and improved drainage each carry a different cost and payback period, and ranking them by return turns a scattered list into a plan a board can actually approve.
What happens if a division does nothing?
A credible group-level case states the cost of inaction alongside the cost of each measure, so the board sees a genuine trade-off rather than a single division's request in isolation.
Where insurance claims, premiums or excess are likely to rise?
Sites with a worsening loss history, or that an insurer's own hazard models flag as deteriorating, are the ones facing the steepest premium or excess increases at the next renewal, so pulling those sites forward in the adaptation queue can offset that pressure before it lands.
Practical tip: Sequence adaptation spend against a single group-level ranking of expected loss, not against which division's business case reaches the board first.
What does audit-ready, consolidated reporting look like across divisions?
Audit-ready, consolidated reporting documents the methodology, assumptions and data lineage behind every division's figures on one common basis, so they roll up into a single group-level disclosure rather than requiring finance to reconcile several incompatible reports by hand. This is what makes the output usable for IFRS S2, the International Sustainability Standards Board's climate-related disclosure standard, since IFRS S2 expects a consistent methodology behind the figures a group discloses, not a patchwork of division-level approaches. Get clear, written answers on:
Whether every division used the same methodology: A group-level figure is only as reliable as its weakest division's data, so an inconsistent methodology anywhere in the estate undermines the whole disclosure.
What assumptions sit behind each division's figures: Time horizons, asset values and vulnerability scores all rest on assumptions, and an auditor needs those stated per division rather than buried inside a consolidated total.
How the group-level figure gets reviewed and updated: Hazard data, asset values and the estate itself all change as divisions acquire or dispose of sites, so a report needs a stated review cycle rather than a snapshot filed once and left to age.
How group-level methodology supports local compliance: Running one methodology from the group down, then applying a local regulatory lens on top, lets each regional team meet its own disclosure requirements, whether that's UK SRS, CSRD or the AASB's climate-related standard in Australia, from the same underlying data rather than building a separate methodology market by market.
How SmartResilience helps you keep a manufacturing climate risk assessment live across every division
Most manufacturers reach the same point after a first assessment: a report, division by division, that goes stale the moment the next reporting cycle starts. Keeping that assessment live and consistent across every division is what SmartResilience Climate Assessments do:
One methodology across every division and site: The platform applies the same hazard, exposure and financial-quantification approach across factories, warehouses and supply chain nodes in every division, so figures roll up into one group-level view rather than several incompatible ones.
Adaptation measures ranked by return, group-wide: Teams see which measures pay back and over what period across the whole estate, not just within one division, so capital allocation decisions get made on a comparable basis.
Outputs that stay current as the estate changes: Figures update as hazard data, asset values and the estate itself change, rather than fixing a snapshot in place until the next commissioned report.
A global agri business replaced a black-box consultancy report with exactly this kind of live capability, deploying across 53 countries in 6 weeks and mitigating £70m in climate resilience risks over a 10-year horizon, at over 50% lower analysis cost than its prior provider.
SmartResilience
See SmartResilience in action
Book a free demo tailored to your organisation and assets.
Book a free demoWhat's next
A manufacturer with three divisional reports and no way to compare them needs one methodology run consistently across all of them, not another assessment added to the pile. The division that runs its next assessment on a shared, live basis is the one whose board sees a single ranked list of risk across the whole estate, rather than a stack of reports that each answer a different, narrower question. That is the decision in front of any manufacturer whose divisions have already assessed their own patch and never rolled the results up into one.
FAQs
What are the steps in a physical climate risk assessment for a manufacturing business? Five steps: identify the hazards that matter across the estate, map exposure and vulnerability at every factory, warehouse and supply chain node, quantify the financial cost per site, prioritise adaptation spend by return across divisions and produce one consolidated, audit-ready report.
How do you assess risk across factories, warehouses and supply chain sites together? Score exposure and vulnerability at asset level across three tiers, owned factories, owned warehouses and supply chain nodes you don't own, rather than treating owned sites as the whole estate and supply chain risk as a separate exercise.
How is financial exposure quantified per site, not just hazard likelihood? Each site gets a modelled average annual loss and a probable maximum loss at material return periods, using one methodology across every division, so sites can be ranked against each other rather than read as isolated hazard scores.
How does a manufacturer prioritise adaptation spend across a multi-division estate? Rank every measure, at every site, by return on investment on one shared scale, sequenced against a group-level ranking of expected loss rather than letting each division build its own case in its own terms.
How is this different from a static consultancy climate risk report? A static report is fixed at the point of delivery and typically refreshed every one to two years. A live assessment keeps the same methodology running continuously, so figures stay current as hazard data, asset values and the estate itself change.
How do you model dependencies like power, infrastructure and water? Score them as part of the vulnerability question at each site: a structurally sound plant can still fail operationally if the power feed, an access route or a water source it depends on is disrupted, so each dependency needs its own line in the assessment rather than an assumption that a sound building is a safe one.